
Front Desk Staffing Ratio per Provider: Benchmarks and a Worksheet
Public front desk staffing benchmarks are thinner than the numbers quoted at conferences. Here is what AMGA and MGMA actually publish, and a worksheet that turns your own volume into FTEs.
Key takeaways.
- AMGA 2024 survey of more than 7,500 clinics found 2.15 total clinic staff FTEs per provider FTE, nearly unchanged from 2.13 in 2020.
- An MGMA analysis of 2016 data found 1.56 front-office staff per physician in the most productive multispecialty groups.
- Neither is a front-desk ratio for a small practice; build yours from phone hours, visit hours, and other desk tasks.
- In the worksheet example, 19.5 hours of desk work divided by 6.5 productive hours gives 3.0 FTEs, or 1.0 per provider.
- Automation removes routine calls and check-in time; in the example, half the calls automated frees about 4 hours a day.
Table of Contents8 sections
Every time someone at the front desk quits, the same question comes up: how many front desk staff should we have per provider? It usually gets answered with a number overheard at a conference. The public benchmarks are thinner than that number suggests, and most of what is quoted comes from paid datasets few practices have seen. AMGA's 2024 staffing survey of more than 7,500 clinics put total clinic staff, front and back office together, at 2.15 FTEs per provider FTE.
This post sets out the front desk staffing ratio per provider figures that are actually public, why they only get you partway, a worksheet that turns your own call and visit volume into hours and FTEs, what automation can take off the desk, and how to choose a ratio you can defend.
What the public staffing benchmarks say
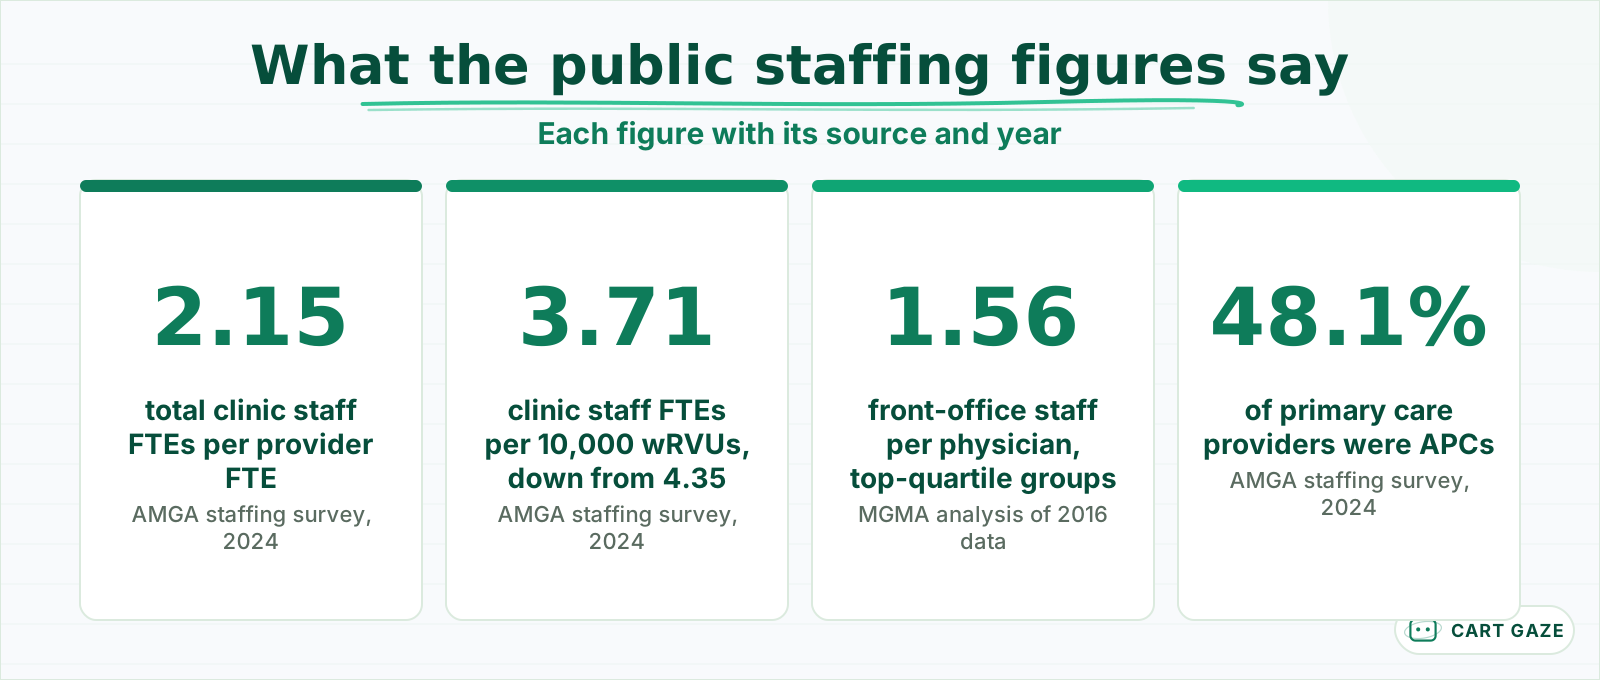
Public staffing benchmarks are few. AMGA's 2024 survey reports 2.15 total clinic staff per provider, and an MGMA analysis of 2016 data found 1.56 front-office staff per physician in its most productive multispecialty groups. Neither is a front-desk ratio for a small independent practice, so treat both as context.
 Large-group and older data. Useful context, not a target for a small practice.
AMGA's 2024 Medical Clinic Staffing Survey covered more than 7,500 clinics and over 31,000 providers, mostly in larger medical groups and health systems. It found 2.15 total clinic staff FTEs per provider FTE, almost unchanged from 2.13 in 2020. Adjusted for productivity, staffing fell from 4.35 FTEs per 10,000 wRVUs in 2020 to 3.71 in 2024, a 14.7% drop: providers were doing more work with about the same number of people around them.
AMGA also found advanced practice clinicians made up 48.1% of the primary care provider workforce in 2024, up from 39.6% in 2020. That matters for any per-provider ratio, because a practice counting nurse practitioners and physician assistants as providers will get a different answer from one counting physicians only.
The MGMA figure is older and narrower. A 2017 MGMA analysis of 2016 cost and revenue data found that the most productive quartile of multispecialty groups had 1.56 front-office support staff per FTE physician, a category that includes receptionists, medical records, and similar roles that keep patients moving. MGMA's current benchmarks by specialty and practice size are in its paid DataDive product.
Important
Be careful with front desk ratios you hear quoted without a source. Most current per-specialty figures sit behind paid benchmarking products, and the public ones describe large groups or are several years old. Your own workload is a better guide than any of them.
Why a ratio alone gets you only partway
A per-provider ratio assumes every provider generates the same front-desk work. They do not. Call volume, visit count, new-patient share, insurance complexity, and how much the desk also does billing or records all change the workload. Two practices with 3 providers each can need very different desks.
Call volume is the biggest swing. A pediatric practice fielding sick-child calls every morning and a dermatology practice with mostly scheduled follow-ups can have the same number of providers and wildly different phones. So can a practice that has moved scheduling online and one that books everything by phone.
What the desk does besides phones matters just as much. In some practices the front desk also verifies insurance, scans records, collects copays, and handles referrals. In others, those tasks sit with a billing team or a central office. A ratio that ignores the job description compares different jobs.
Structure changes the ratio too. A group that routes all calls to a central scheduling team needs fewer people at each site's desk but more in the call center, and a per-site ratio will look low while the total is the same. Count every person who does front-desk work, wherever they sit, before comparing.
That is why the useful number is hours of front-desk work per day, built from your own volume, converted into FTEs. The ratio falls out at the end, and you can compare it with the benchmarks knowing what is inside it.
A worksheet: turn your workload into FTEs
Estimate front-desk hours from three sources: phone time, check-in and check-out time, and other desk tasks. Add them, divide by the productive hours one FTE actually has in a day, and you have the FTEs your workload needs. Divide by providers for your own ratio.
| Line | How to get it | Example |
|---|---|---|
| Providers | Count FTE providers | 3 |
| Calls per day | 4 weeks of phone reports, average | 120 |
| Minutes per call | Average handle time from the phone system | 4 |
| Phone hours | Calls x minutes / 60 | 8.0 |
| Visits per day | Schedule report | 75 |
| Check-in and out minutes per visit | Time 20 visits | 6 |
| Visit hours | Visits x minutes / 60 | 7.5 |
| Other desk tasks | Verification, forms, scanning, per day | 4.0 |
| Total hours | Sum of the three | 19.5 |
| FTEs needed | Total / 6.5 productive hours per FTE | 3.0 |
The example is an illustration, not a benchmark. It works out to 1.0 front-desk FTE per provider for a practice whose desk handles phones, check-in, and some verification. A desk that also runs billing or records would come out higher.
Get the inputs from measurement, not memory. Average handle time from the phone system usually includes talk time but not the minute of typing after the call, so add that. For check-in and check-out, time 20 visits across a few days with a stopwatch, including insurance card scans and copays. Estimates made at a staff meeting tend to come in low.
The 6.5 productive hours per 8-hour shift allows for breaks, handoffs, and interruptions. Use your own figure if you know it, and remember that peak hours need more people than the daily average suggests. How to size for peaks rather than averages is covered in forecasting front desk call volume and staffing.
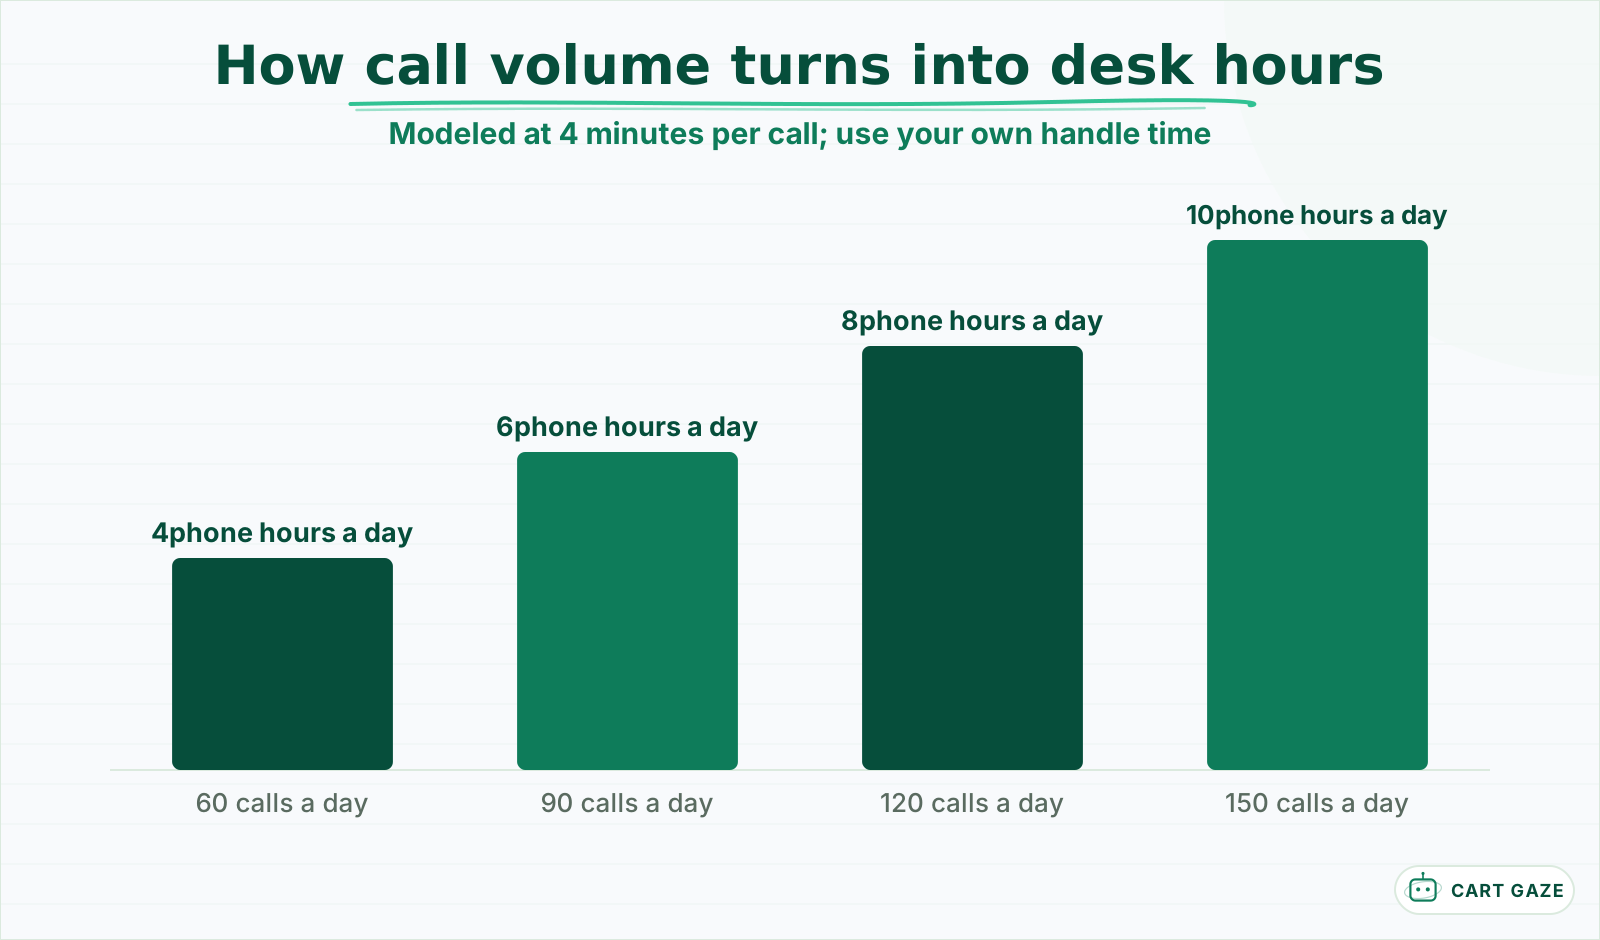 Modeled at 4 minutes a call. Phone time alone can be a full FTE before anyone checks a patient in.
Staff the peaks, not just the day
A daily ratio can be right and the desk still overwhelmed, because the work arrives in bursts. The first hour of the day, the hour after lunch, and Monday mornings carry a large share of calls and arrivals. Run the worksheet by hour for the busiest day, and staff those hours first.
Three moves cover most peaks without adding a full-time person. Staggered start times put a second person on the phones for the first 2 hours instead of the whole day. A float, often a medical assistant or billing staff member trained on scheduling, can pick up the phones at set times. And an overflow rule sends calls that ring past a set number of seconds to an answer that can book, rather than to voicemail.
The worksheet by hour also shows the quiet stretches. Mid-afternoon is often when verification, scanning, and callbacks can be done without anyone waiting, so moving that work there frees morning hours for phones and arrivals.
What automation removes from the ratio
Automation removes routine work, not the desk. The largest share is usually routine calls: bookings, reschedules, confirmations, directions, and hours. Online intake and check-in remove some visit time. What remains is the work that needs a person, and it is often the work that was being squeezed out.
In the worksheet example, phone time is 8.0 of 19.5 hours. If half of those calls are routine and an AI receptionist or online self-service handles them, that is about 4 hours a day, roughly 0.6 FTE. Online forms that cut check-in from 6 to 4 minutes per visit save another 2.5 hours. Those figures are modeled from the example, and your mix will differ.
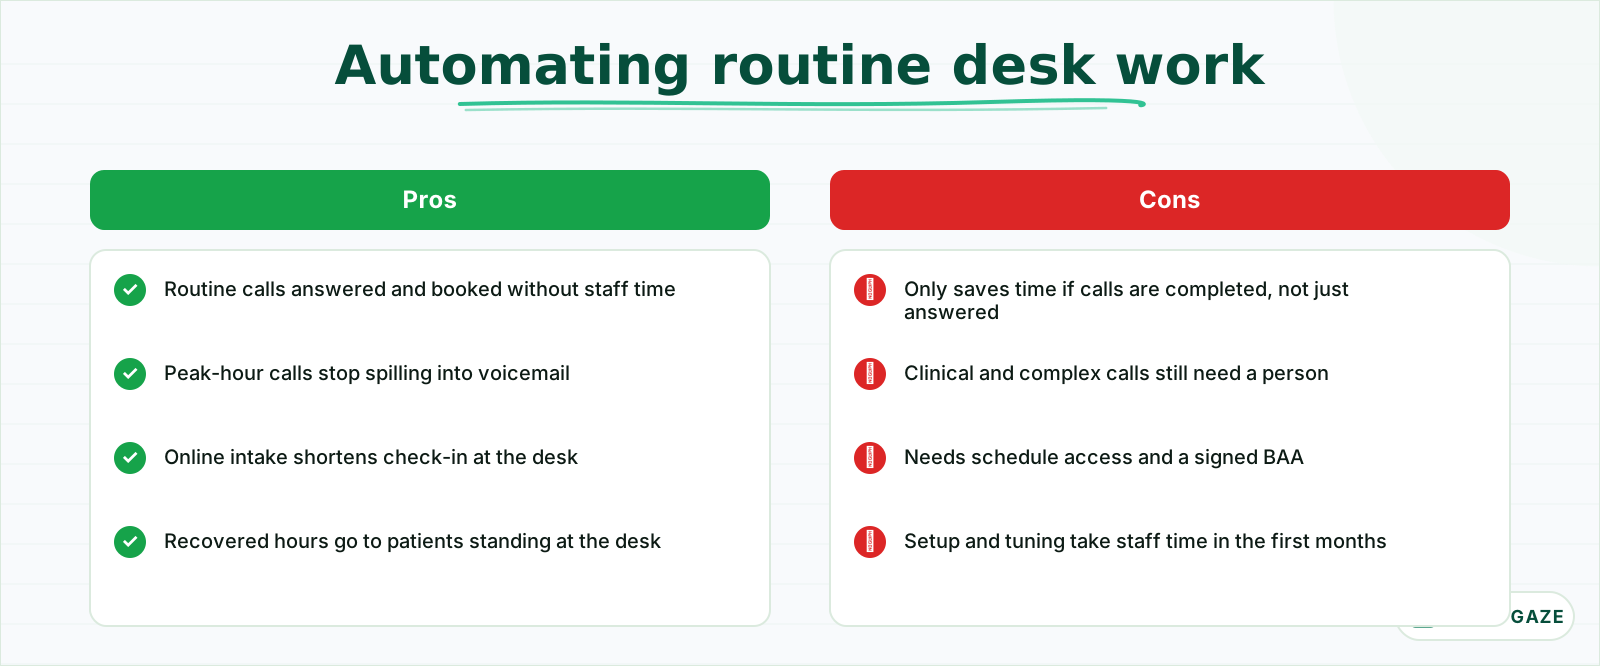 Automation earns its place only if the hours actually move on the next worksheet.
What happens to the recovered hours is the more important question. The better use is rarely a cut in staff: it is fewer lost calls at peaks, less overtime, and time for the patient standing at the desk. Turnover is its own cost, and how automation affects burnout and retention at the desk is covered in front desk burnout and retention.
An AI receptionist only removes work if it completes it. It must book into the real schedule, pass everything else to staff with the reason attached, and route every clinical, urgent, or distressed caller to a person. It never assesses symptoms or gives medical advice. What it does and where it stops is set out in what an AI receptionist does and where it hands off.
Tip
Re-run the worksheet 3 months after any automation goes live, using the new phone and check-in numbers. If the hours did not move, the automation is answering calls without finishing them.
Choosing a ratio you can defend
Choose a ratio from your own worksheet, not from a benchmark. Compare it with public figures only to sanity-check, adjust it for peaks, and write down what the desk is expected to do. Then revisit it whenever call volume, visit volume, or the desk's job description changes.
A defensible ratio has three parts: the workload behind it, the peak coverage it provides, and the list of tasks it covers. "1.0 per provider, covering phones, check-in and verification, with a second person on the phones from 8 to 10 a.m." can be explained to a partner or a new manager. "The benchmark says 1.5" cannot.
Watch three signals that the ratio is wrong in practice: calls going unanswered at peaks, regular overtime, and turnover at the desk. Any one of them is worth a fresh run of the worksheet. Keep the worksheet and its assumptions in the same document as the desk's job descriptions, so the next manager inherits the reasoning behind the ratio and not just the number.
Before you set a front desk ratio
- The worksheet uses 4 weeks of your own call and visit data.
- Peak hours are staffed separately from the daily average.
- The desk's task list is written down and matches the hours.
- Any automation's effect is measured, not assumed.
Set your staffing ratio
Run the worksheet with 4 weeks of your data, compare the FTEs it gives with what you staff, and check peaks, overtime, and turnover. If you are short, find which task drives the gap before hiring. If routine calls drive it, remove them with automation first.
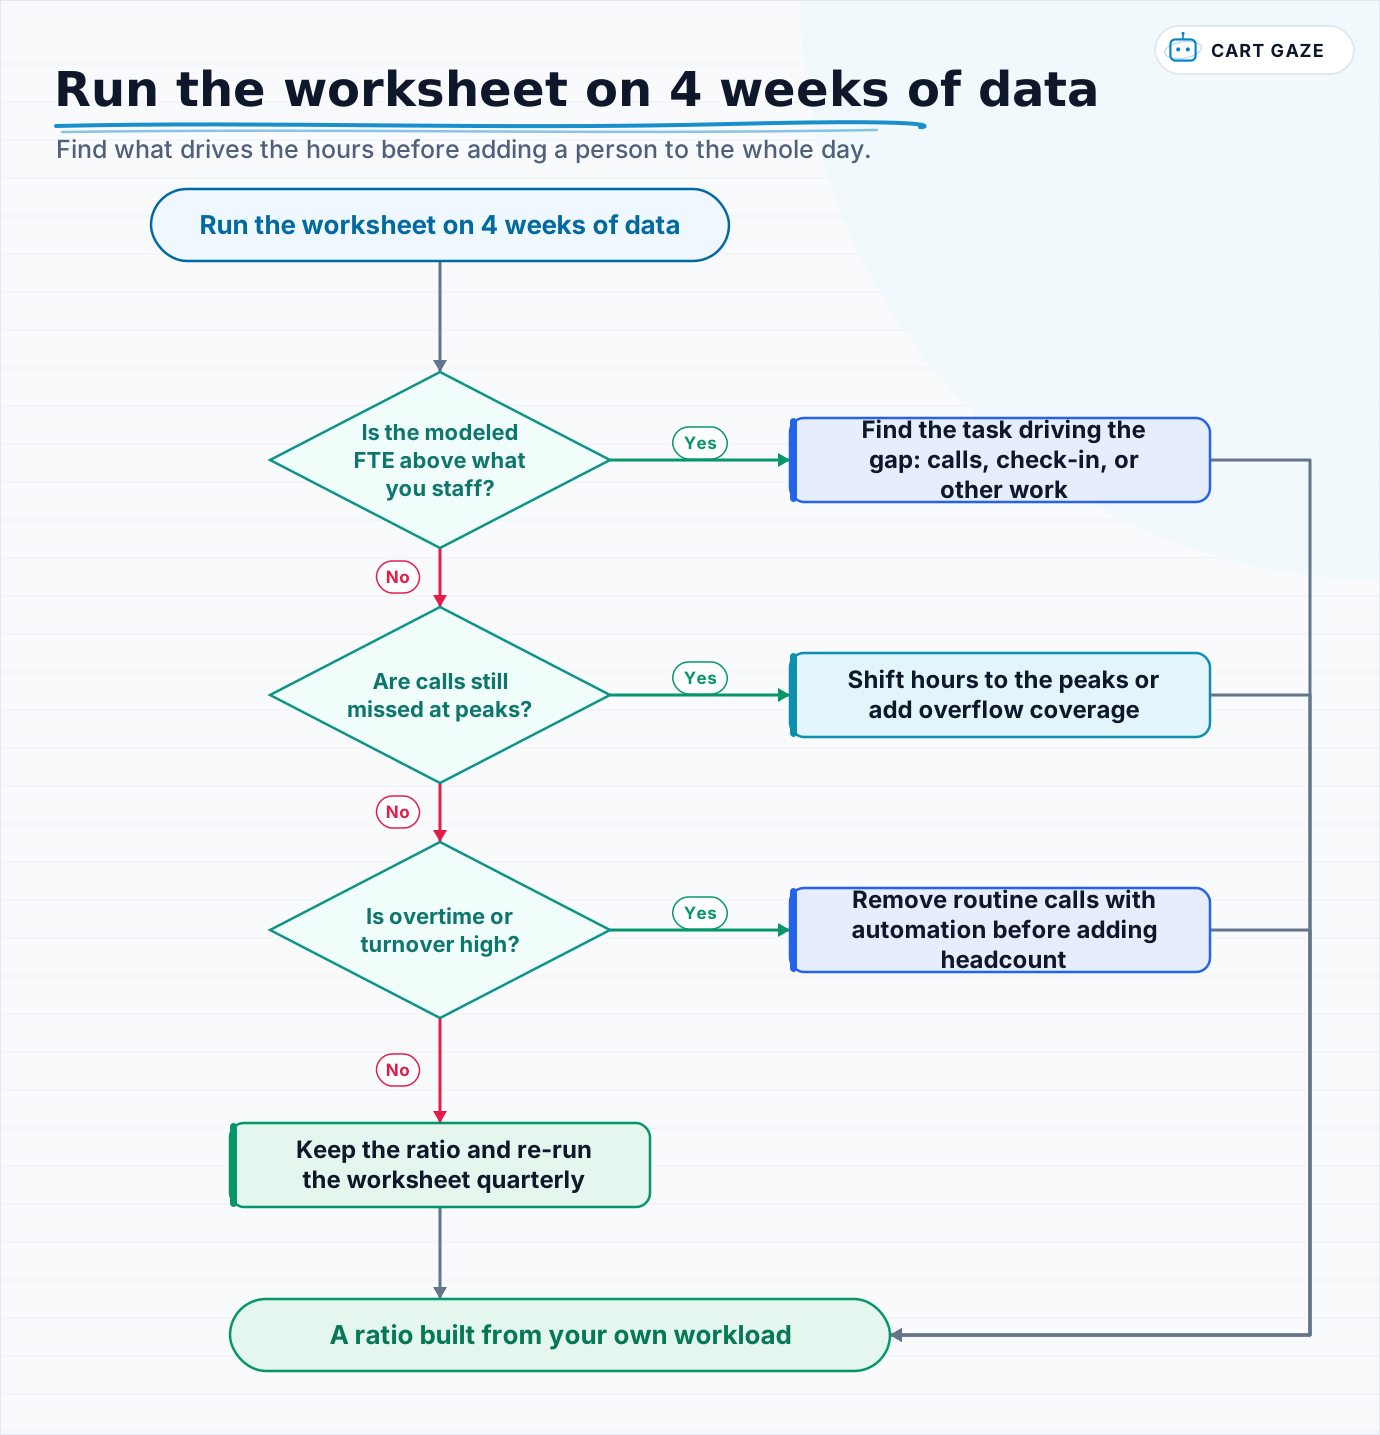 Find what drives the hours before adding a person to the whole day.
Walk the flow with your worksheet in front of you. Most practices find the answer is not one more person across the whole day, but coverage in the 2 or 3 hours when the phones and the lobby peak together.
To see how routine calls get answered and booked so the desk can focus on patients in front of it, what an AI receptionist does on a live call walks through a booking, a transfer to staff, and a hand-off.
Fair questions.
How many front desk staff per provider does a medical practice need?
It depends on your workload more than your provider count. Public benchmarks are limited: AMGA reported 2.15 total clinic staff per provider in 2024, and MGMA found 1.56 front-office staff per physician in top multispecialty groups using 2016 data. Build your own number from call volume, visit volume and other desk tasks, then compare.
How do you calculate front desk staffing needs?
Add three things per day: phone hours (calls times average minutes, divided by 60), visit hours (visits times check-in and check-out minutes, divided by 60), and other desk tasks. Divide the total by the productive hours one FTE has in a day, often about 6.5 of 8. That gives FTEs; divide by providers for a ratio.
Are MGMA front desk staffing benchmarks free?
Mostly not. MGMA current staffing benchmarks by specialty and practice size are in its paid DataDive product. Some older figures appear in public MGMA articles, such as 1.56 front-office staff per physician in top-quartile multispecialty groups from 2016 data. Treat unsourced ratios quoted online with caution.
Does an AI receptionist reduce front desk staffing needs?
It reduces routine phone work if it completes calls, such as bookings and reschedules, rather than just answering them. In a modeled example, automating half of 120 daily calls at 4 minutes each frees about 4 hours a day. Most practices use that time to cover peaks and reduce overtime rather than to cut staff.
Why do front desk staffing ratios differ so much between practices?
Because the workload per provider differs. Call volume, visit count, new-patient share, insurance complexity, and whether the desk also handles billing or records all change the hours needed. Whether nurse practitioners and physician assistants are counted as providers changes the ratio too; AMGA found they were 48.1% of primary care providers in 2024.
Sources.
Written by

Muhammad Qasim Hammad
Founder, Cart Gaze
Qasim builds AI receptionists and front-office automation for medical and dental practices at Cart Gaze. Posts here start from published sources and real call data, not vendor claims, and every number links back to where it came from.
Keep reading.
 Missed Calls & Front DeskCall Volume Forecasting for Your Front Desk: Staff the Peak11 min read
 Missed Calls & Front DeskDo You Take My Insurance? How to Answer Without Losing the Booking10 min read
 Missed Calls & Front DeskPatient Callback Requests: How to Offer, Staff and Automate Them10 min read
 Missed Calls & Front DeskCall Hold Time Benchmarks for Medical Practices: When Callers Hang Up12 min read
 Missed Calls & Front DeskPatient Complaint Triage: Catch It Before It Costs You a Review10 min read
 Missed Calls & Front DeskFamily Scheduling Automation: Book Every Kid in One Call10 min read