
Call Volume Forecasting for Your Front Desk: Staff the Peak
A typical Monday runs about 1.5x a midweek day, yet most practices roster the same team all week. Here is how to forecast your call curve from records you already have, and what each peak costs to cover.
Key takeaways.
- Practice call volume repeats on 3 scales, intraday, day of week and seasonal, and one vendor network of 297 practices logged about 11,500 sessions on a typical Monday against 7,500 to 8,000 on the
- Staffing to the arithmetic average misses the peak by design: a published Erlang C example needs 14 agents to answer 80% of calls inside 20 seconds on work that averages only 10 agent hours per hour.
- Build the forecast from 8 to 13 weeks of call detail records, bucketed into 30 minute slots by weekday, using the median of each slot rather than the mean so one freak day cannot move the plan.
- Sort every peak by how reliably it repeats and what it costs to miss, which produces 4 different remedies: roster to it, absorb it with elastic coverage, deflect it to self-service, or accept it.
- A peak-only seat of 15 hours a week models to roughly $17,000 a year against the $45,930 median annual wage BLS reported for medical secretaries in May 2025.
Table of Contents8 sections
- Your call volume has a shape, and the shape repeats
- Why staffing to the average guarantees a miss at the peak
- Build the forecast from call records you already have
- Sort your peaks before you spend anything on them
- What each kind of peak costs to cover
- Where AI overflow genuinely fits, and where it does not
- Decide what to do about next Monday
- Fair questions
Your front desk is not short-staffed all day. It is short-staffed between 9 and 11 on a Monday, and comfortably staffed by 3 p.m. on a Thursday, and the schedule treats both hours the same. CallMyDoc, which runs patient calls for 297 practices, published a breakdown of 4.7 million call sessions from 2025: about 11,500 sessions on a typical Monday against 7,500 to 8,000 Tuesday through Friday.
That is a shape, not noise. Practice phone traffic has an intraday curve, a day-of-week curve, and a seasonal curve, and all 3 repeat closely enough to plan against. Almost nobody plans against them. The same people sit at the desk at 9:15 on Monday and at 3:15 on Thursday, and the Monday callers are the ones who hear a queue and hang up.
This post covers how to build that forecast from call records you already have, why staffing to the average is arithmetically certain to miss the peak, how to sort each peak into 1 of 4 things you can actually do about it, and what each of those 4 costs.
Your call volume has a shape, and the shape repeats
Practice phone traffic is not random. It rises through the morning, peaks mid-morning, dips at midday, holds through the afternoon, and falls off after 5 p.m. Layered on that is a heavy Monday and a seasonal swing. Those 3 patterns repeat closely enough week to week to forecast from your own log.
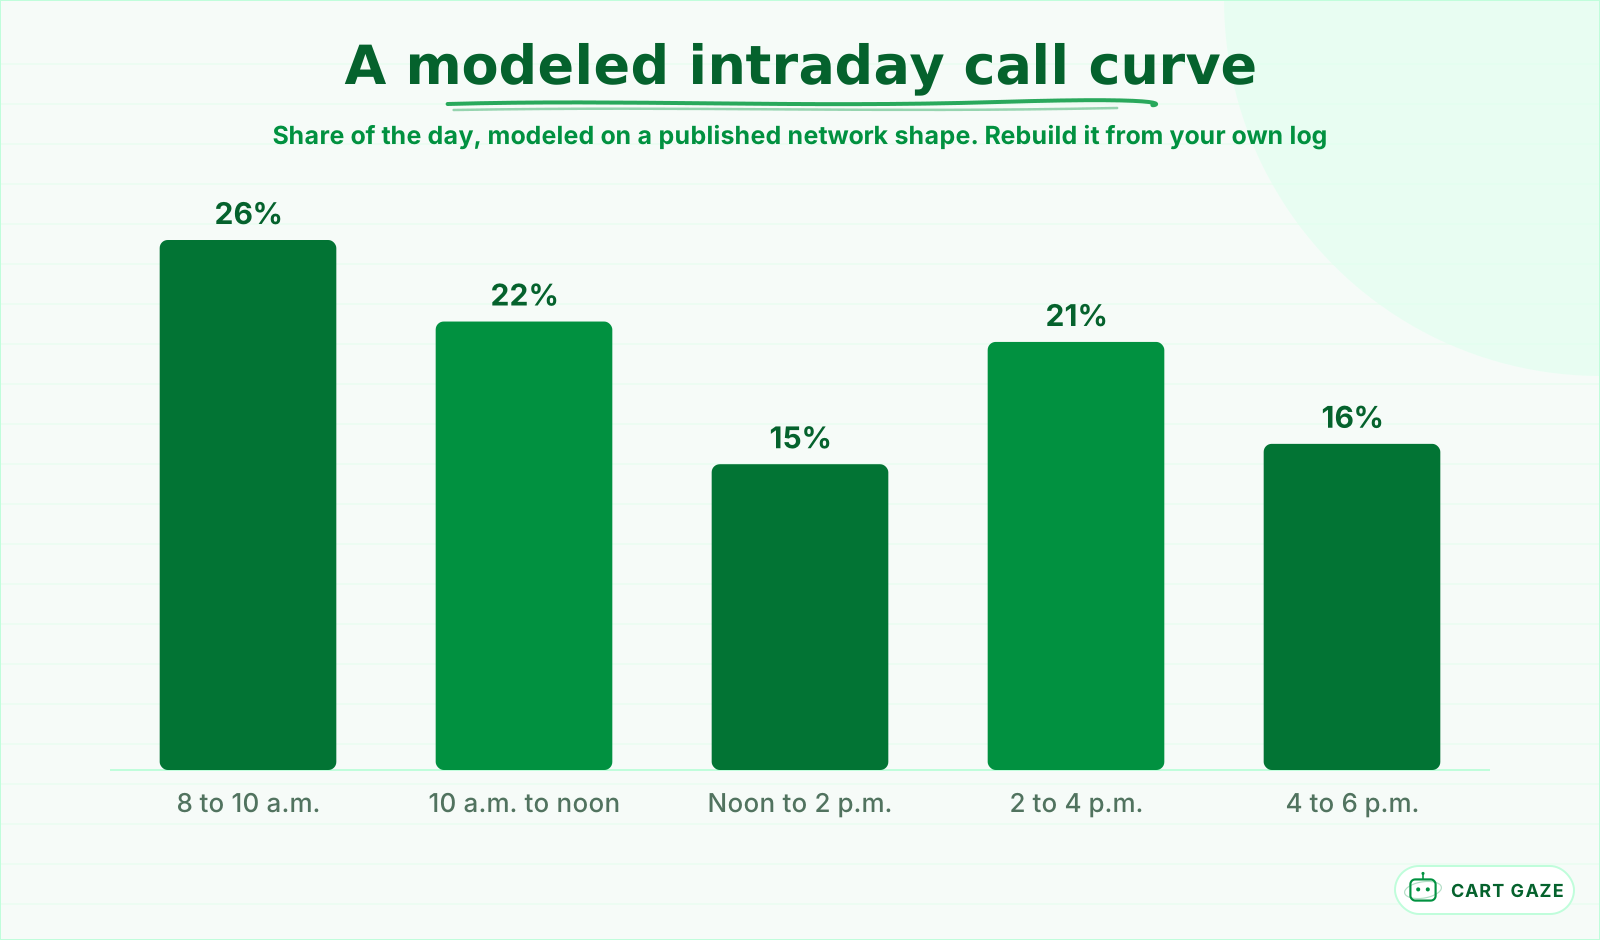 Modeled from a published network shape. The midday dip is real, and so is the staffing dip under it.
CallMyDoc describes the intraday shape from its own network: volume builds from 6 a.m. peaks at 200 or more sessions an hour from 9 to 11 a.m. holds through 4 p.m. then drops sharply after 5 p.m. Read that hourly figure as the whole network rather than one practice, because 297 practices sit behind it. The shape is the part you can use.
Modeled onto a working day in 2 hour blocks, that shape puts roughly 26% of the day's calls between 8 and 10 a.m. 22% in the next 2 hours, 15% across midday, 21% from 2 to 4 p.m. and 16% in the closing stretch. Those percentages are modeled, not measured. Yours will differ. The direction will not.
The week has its own shape. On the same network a typical Monday carries about 11,500 sessions against 7,500 to 8,000 on the other 4 days, roughly 1.5x a midweek day, and most practices roster the same team every day and absorb Monday with abandoned calls.
The year has a shape too. CDC data puts flu activity peaking between December and February, and across 40 tracked seasons it landed in February 17 times, December 7 times, January 6 and March 6. Zocdoc platform data shows the Tuesday after Labor Day drawing roughly 20% to 25% more appointments than the Tuesday before it, and August pediatric bookings in New York City running more than 20% above average. Those are bookings rather than calls, so read them as a demand signal, not a call count. Deductibles for most plans reset on January 1, which pushes elective work into December and coverage questions into January.
One trap sits inside the daily curve. Midday volume dips, but staffed capacity dips harder, because that is when people take lunch. The worst ratio of calls to available people is often not your busiest hour.
Why staffing to the average guarantees a miss at the peak
Because calls arrive in bursts, a desk that is exactly big enough on average is badly undersized for a third of the day. Queue waiting time does not rise smoothly as you approach capacity, it rises steeply, so the last few percent of headroom buys most of the answered calls.
Call Centre Helper publishes a worked Erlang C example that makes this concrete: 100 calls in a 30 minute window, 3 minutes of handling time each, and the ordinary target of answering 80% of calls inside 20 seconds. The raw workload comes to 10 agent hours per hour. Here is what each headcount delivers against that target.
| Agents on the phones | Calls answered inside 20 seconds | What that headcount means |
|---|---|---|
| 10 | Queue never clears | The raw workload, not a staffing level |
| 11 | 39.0% | Most callers wait |
| 12 | 64.0% | Still well short |
| 13 | 79.6% | Just under target |
| 14 | 88.8% | Target met, with headroom |
Look at the step from 12 people to 14. Those 2 extra seats lift the share answered inside 20 seconds from 64.0% to 88.8%, while the first 10 seats buy no service level at all, because the average work consumes them. Hitting an ordinary target takes 40% more staff than the arithmetic average of the work, and that gap is why "we have enough people for the volume" keeps producing missed calls.
Warning
Erlang C assumes calls arrive randomly and that nobody ever hangs up. Patients hang up, and a 3 seat front desk is far below the size where the math behaves cleanly. Use it for the direction, which is solid, and never as a headcount you would defend to a partner.
The practical version for a small desk is short. Whatever your busiest 30 minutes needs, you need visible slack inside it, and slack looks like waste on every day except the one that matters.
Build the forecast from call records you already have
Export 8 to 13 weeks of call detail records from your phone system, bucket every call into 30 minute slots by weekday, then take the median of each slot across weeks. The median ignores one freak Monday. Read the peak slot, never the daily average, because the peak is what fails.
The method is not improvised. Workforce management tools have forecast this way for decades: Pipkins documents 15 or 30 minute intervals, a rolling 6 week history by default, and the median rather than the mean as the central estimator, precisely so one snow day does not move the plan. Take 8 to 13 weeks instead of 6 and you cover a full quarter, both halves of a month, and at least 1 holiday.
Then overlay capacity on top of arrivals. For each 30 minute slot, write down who is genuinely free to answer, after lunches, huddles, check-in rushes and the 20 minutes somebody spends on hold with a payer. A slot with 14 calls and 1 free person is a worse problem than a slot with 20 calls and 3.
Important
If your phone system logs only answered calls, your busiest slot will look artificially flat, because it is capped by your own capacity rather than by demand. You need offered calls, including abandoned ones. A log that cannot show you an abandoned call cannot show you a peak.
Definitions matter here and are easy to get wrong. Abandonment, time-to-answer and voicemail rate each mean something specific inside your system's reports, and the front desk call metrics worth tracking sets out what each one counts before you start dividing.
Sort your peaks before you spend anything on them
Not every peak deserves a remedy, and the right remedy depends on 2 things: how reliably the peak repeats, and what it costs you when calls in it go unanswered. Sort each recurring peak on those 2 axes and 4 different answers fall out, only one of which is hiring.
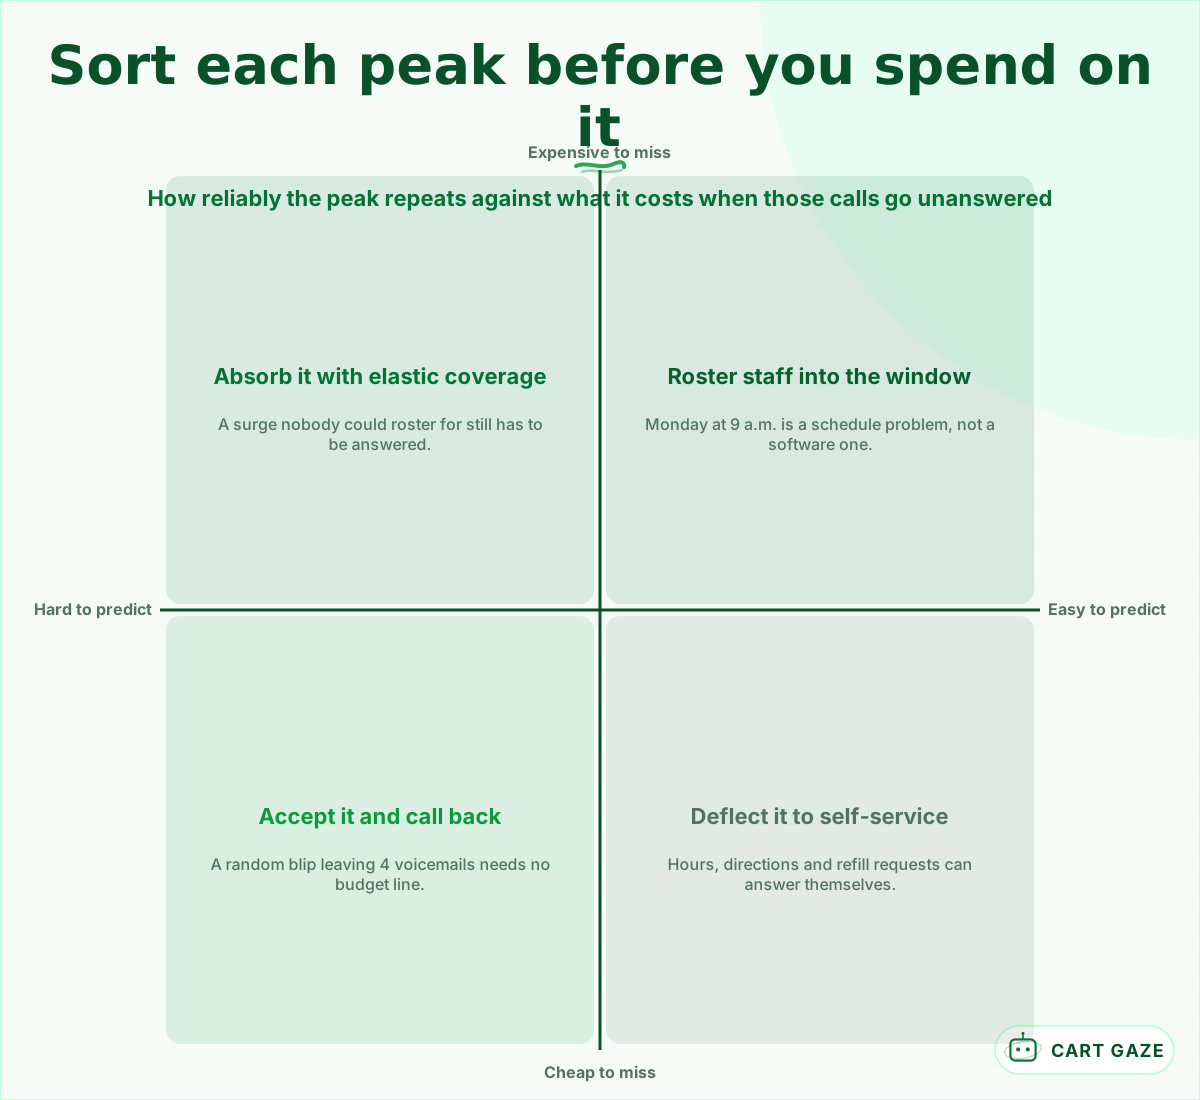 A first sort, not a verdict. Most practices only ever consider the roster box.
A predictable, expensive peak is a rota problem. Monday from 9 to 11 lands every week, and the calls inside it are new patients and same-day requests, so the answer is to move a shift, not to buy software.
An unpredictable, expensive peak is where elastic capacity earns its keep. A respiratory surge or a provider calling in sick produces volume nobody can roster for 6 weeks ahead, and coverage that scales the moment it is needed is the only thing that catches it without carrying the cost all year.
A predictable, cheap peak is a deflection problem. Hours, directions, parking, form questions and refill requests repeat on schedule and do not need a person, so send them to online booking, a text reply, or a recording that actually answers the question.
An unpredictable, cheap peak you can simply accept. A random Wednesday blip that leaves 4 callback voicemails does not need a budget line. Most practices only ever consider the first of those 4 boxes, which is why the answer always comes out looking like a hire.
What each kind of peak costs to cover
Each remedy has a price and a limit. A scheduled shift covers a predictable window and nothing else. Self-service deflection is cheap but only works on calls with no judgment in them. Overflow answering is elastic and usually priced per minute, so it charges you most on your busiest hours.
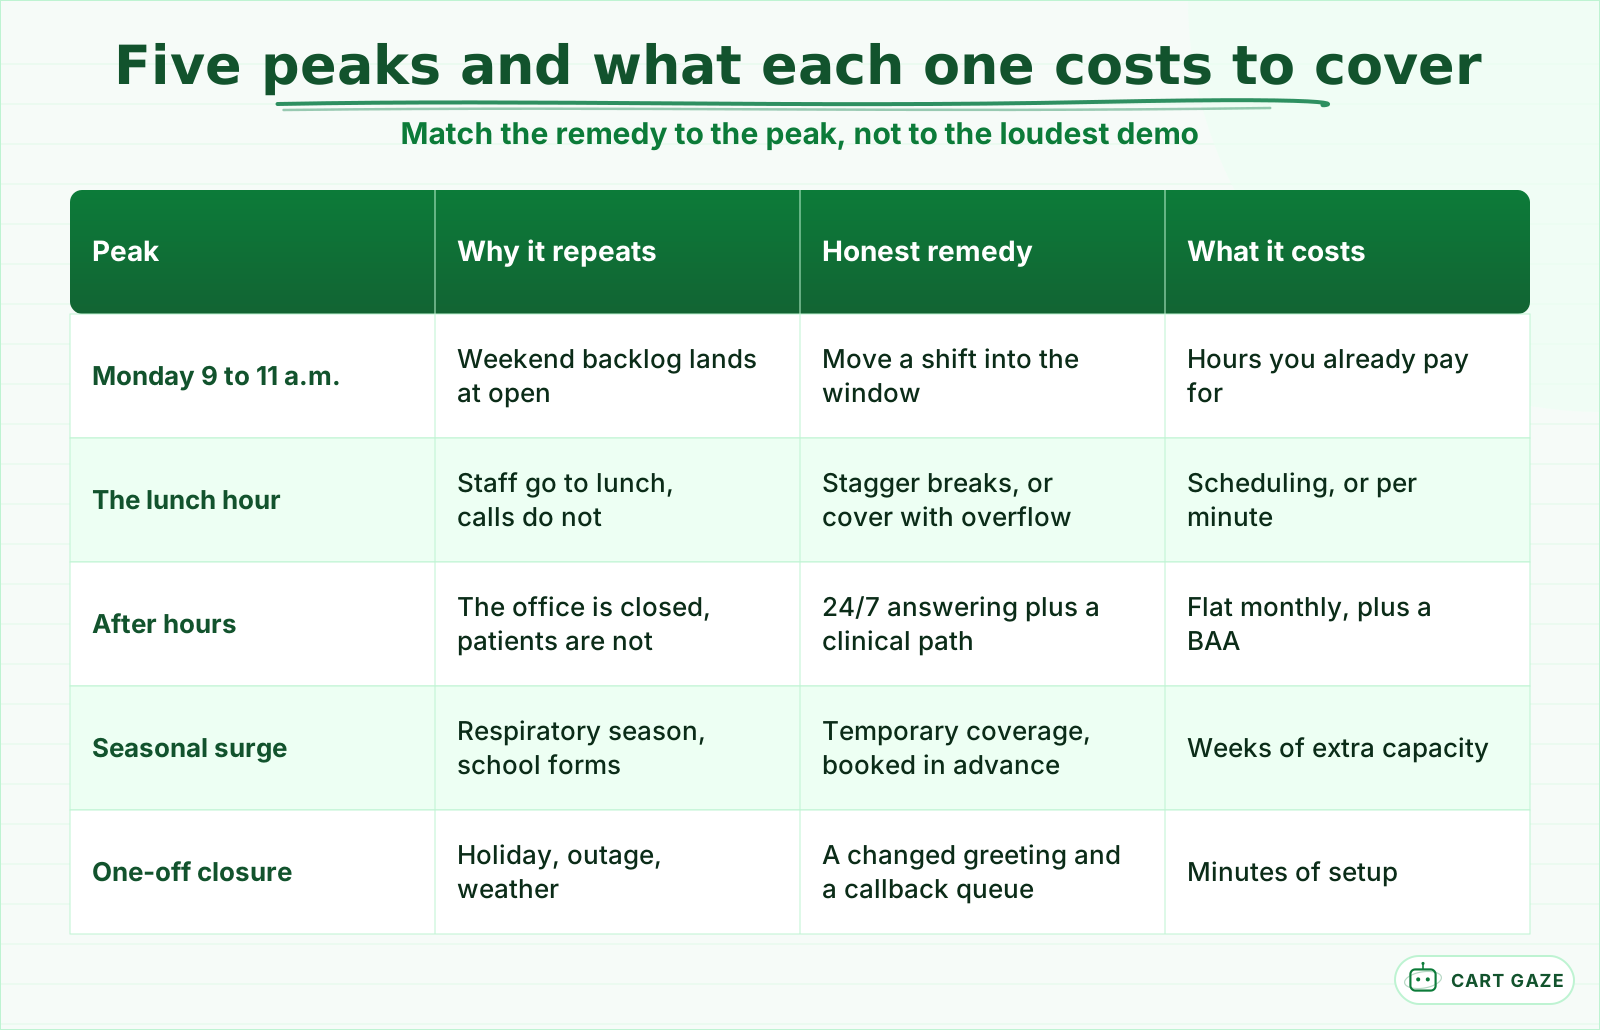 Five peaks, five different answers. Only 1 of them is a new hire.
Price the rostered option properly. The Bureau of Labor Statistics puts the median annual wage for medical secretaries and administrative assistants at $45,930 as of May 2025. A peak-only part-time seat of 15 hours a week works out to about 780 hours a year, roughly $17,000 at that median rate before payroll taxes and benefits. That arithmetic is modeled, so rerun it at your own local rate.
Tip
Per-minute overflow bills you most on exactly the hours you bought it for. If your peak runs 3 hours a day every weekday, model the monthly bill at your peak volume rather than your average one, then compare it against a flat plan before signing anything.
Against those costs sits the value of what you are catching, and that value is worth computing rather than guessing. The real cost of missed calls walks through a 6 input worksheet that turns your own missed-call counts into a monthly figure, and the answer differs enormously between a hygiene call and a surgical consult.
Where AI overflow genuinely fits, and where it does not
An AI receptionist answers the 4th and the 40th simultaneous call the same way, so its capacity does not queue the way a 3 person desk does. That elasticity is worth most at the peak you cannot predict. It is worth least on any call that needs clinical judgment.
Adding an AI line does not remove the need to forecast. It changes what you do with the forecast. Instead of asking how many people you need at 9 a.m. you ask which calls should never reach a person at 9 a.m. and the forecast tells you how many of those there are in the slot.
The boundary is not negotiable. Clinical and urgent calls route to a human, and no automated line should assess symptoms or give medical advice. Anything touching patient details needs a signed Business Associate Agreement, and "HIPAA certified" is not a real thing, so treat any page claiming it as a warning sign. If you have not evaluated one of these systems before, start with what an AI receptionist does and where it stops.
Before you staff to a forecast
- The export includes unanswered and abandoned calls, not only the ones a person picked up.
- Every bucket uses the same 30 minutes and the same weekday across all the weeks you pulled.
- You know who is genuinely free to answer during the peak bucket, including lunch cover.
- A clinical or urgent call has a written path to a human in every hour you are open.
Decide what to do about next Monday
Take the single worst slot in your forecast, name what happens in it today, and pick 1 of the 4 remedies for it. One peak, one owner, one change. Then rebuild the same forecast 30 days later and check whether that slot moved, before you touch anything else.
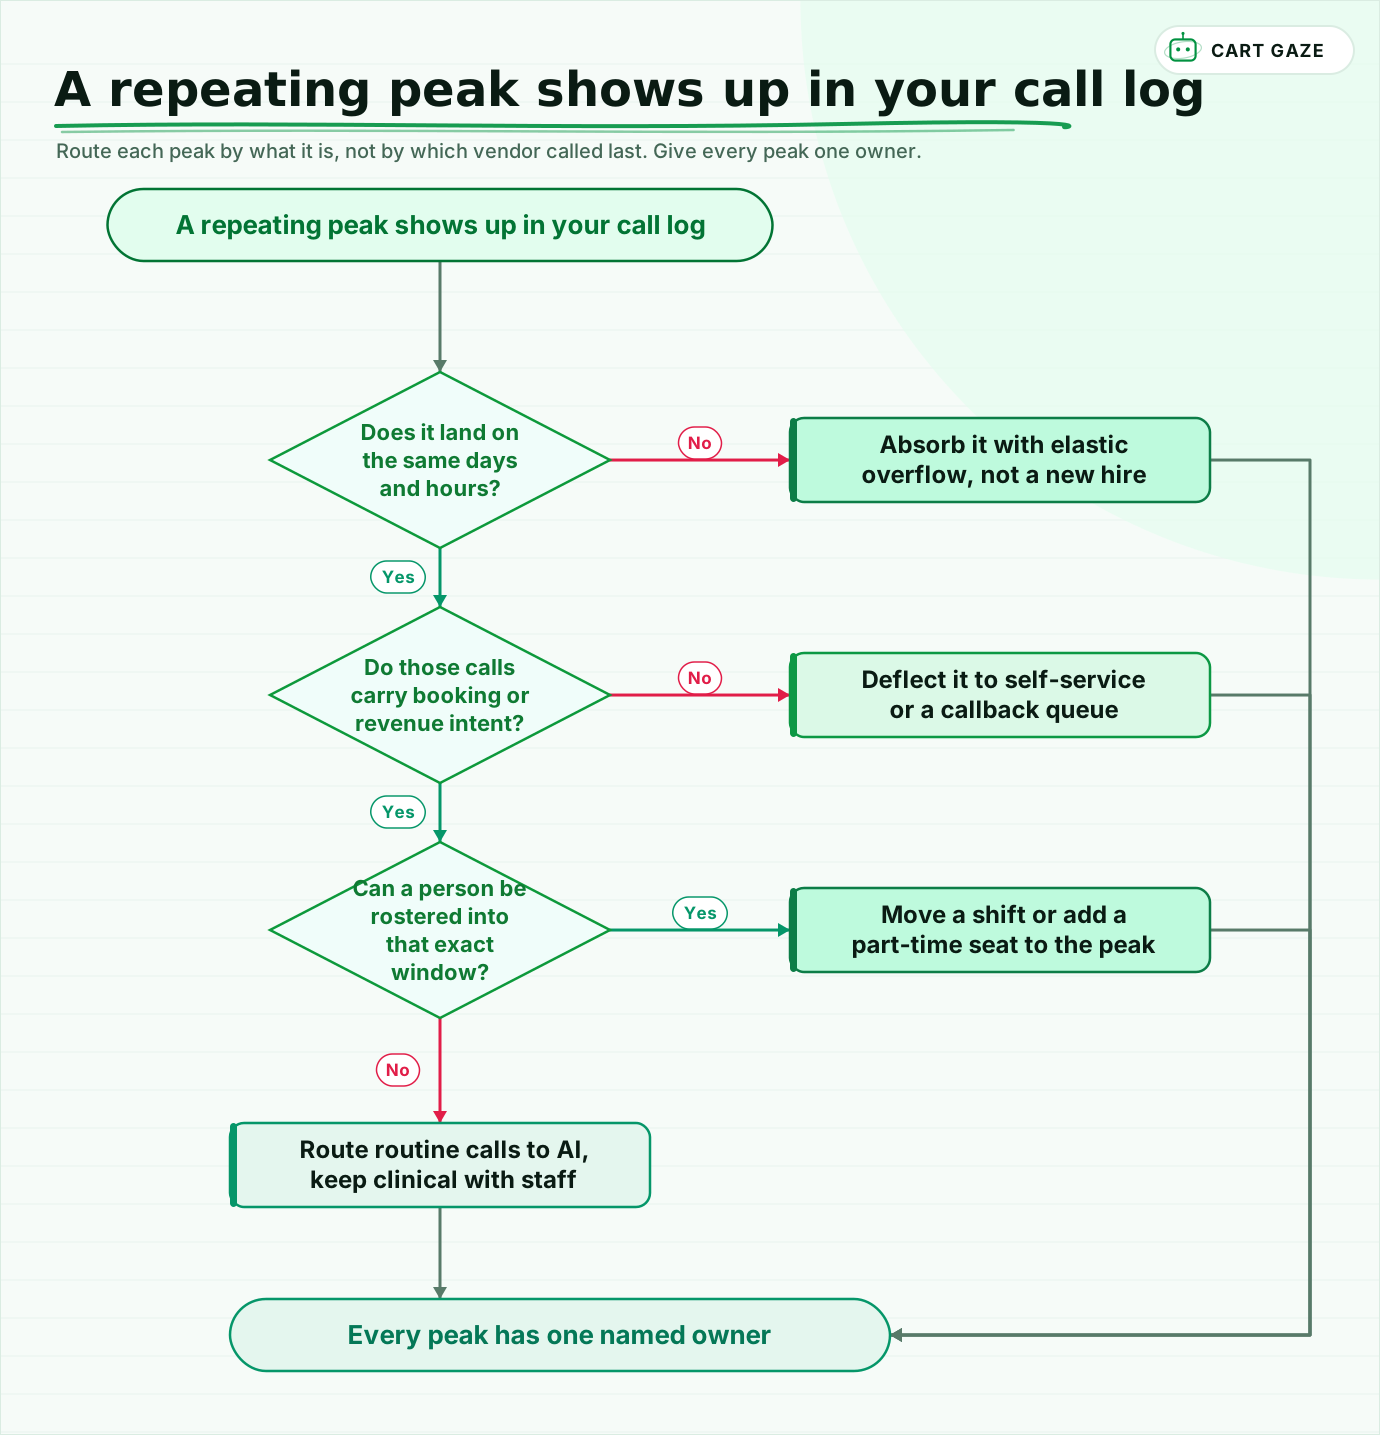 Route each peak by what it is, not by which vendor called last. Give every peak one owner.
Walk it once with your own numbers. A peak landing on the same days and hours is a rostering decision first. One that never repeats is what elastic coverage is for. Calls with no booking or revenue intent belong in self-service, whatever hour they arrive in. And if the window cannot be staffed at all, routine calls can go to an AI line while clinical ones stay with your team.
Then re-measure. The same export, pulled 30 days later, tells you whether the change moved the slot you targeted or simply moved the calls somewhere else. If you would rather see the leak sized before you re-roster anyone, the free Growth Leak Audit runs it from your own call volumes.
Fair questions.
When do medical practices get the most calls?
Volume builds from early morning and peaks mid-morning, roughly 9 to 11 a.m. holds through the afternoon, then falls sharply after 5 p.m. Monday is the heaviest day by a wide margin: one vendor network of 297 practices logged about 11,500 sessions on a typical Monday against 7,500 to 8,000 Tuesday through Friday. Confirm the shape against your own call log.
How many weeks of call data do I need to forecast front desk staffing?
Workforce management tools commonly default to a rolling 6 week history in 15 or 30 minute intervals. For a practice, pull 8 to 13 weeks instead. That covers a full quarter, both halves of a month and at least 1 holiday, which matters because billing cycles and school calendars both move phone volume in ways 6 weeks can hide.
Why does my front desk miss calls when we have enough staff for the volume?
Because calls arrive in bursts, not evenly. Queue waiting time rises steeply rather than smoothly as you approach capacity, so a desk sized to the average has almost no headroom at the peak. In a published Erlang C example, work averaging 10 agent hours per hour needs 14 agents to answer 80% of calls inside 20 seconds.
Can Erlang C be used to staff a 3 person front desk?
Use it for direction, not for a headcount. Erlang C assumes calls arrive randomly and that nobody hangs up, and patients hang up constantly. A 3 seat desk is also far below the size where the math behaves cleanly. The useful takeaway survives anyway: you need visible slack at the peak, and slack looks like waste on quiet days.
Does an AI receptionist remove the need to forecast call volume?
No. It changes what you do with the forecast. An AI line answers many calls at once, so its capacity does not queue the way a small desk does, which makes it strongest at peaks you cannot roster for. You still need the forecast to decide which calls should never reach a person during those hours.
Sources.
- [1]Medical practice call analytics and benchmarking (4.7M sessions, 297 practices, 2025)
- [2]Erlang C formula, worked example with service level by agent count
- [3]How to use Erlang C to plan staffing, and where its assumptions break
- [4]A guide to call arrival distribution: intervals, history window and the median
- [5]CDC: flu season timing and peak months across 40 seasons
- [6]Zocdoc platform data on the post-Labor Day and back-to-school booking surge
- [7]BLS: secretaries and administrative assistants median pay, May 2025
- [8]Deductible reset season for medical practices
Written by

Muhammad Qasim Hammad
Founder, Cart Gaze
Qasim builds AI receptionists and front-office automation for medical and dental practices at Cart Gaze. Posts here start from published sources and real call data, not vendor claims, and every number links back to where it came from.
Keep reading.
 Missed Calls & Front DeskPatient Callback Requests: How to Offer, Staff and Automate Them10 min read
 Missed Calls & Front DeskCall Hold Time Benchmarks for Medical Practices: When Callers Hang Up12 min read
 Missed Calls & Front DeskFront Desk Call Metrics Every Practice Should Track in 202610 min read
 Missed Calls & Front DeskPrescription Refill Automation That Keeps Providers in Control10 min read
 Missed Calls & Front DeskAfter-Hours Call Handling: Cover the 41% Nobody Answers11 min read
 Missed Calls & Front DeskPatient Check-In Automation: Arrive With Nothing Left to Do11 min read