
Call Hold Time Benchmarks for Medical Practices: When Callers Hang Up
Healthcare reports put average hold at 4.4 minutes against a 50-second standard. Here are the published hold-time and abandonment benchmarks, their provenance, and how to read your own queue report.
Key takeaways.
- Published healthcare benchmarks put average hold at about 4.4 minutes and abandonment near 7%, against a 50-second HFMA hold standard and an abandonment goal under 5%.
- The widely repeated "60% hang up after 1 minute" figure is vendor-cited; a 400-person consumer survey found only 6% quit by 2 minutes, so measure your own curve.
- Pull 4 weeks from the call queue report, not the per-user missed-call view, and split abandonment by hour and weekday before choosing a fix.
- Match the lever to the pattern: restaff peaks, offer a callback (75% of surveyed consumers want one), add overflow, or route routine calls to an AI receptionist.
- A phone-system report and a vendor benchmark use different populations, denominators, and clocks, so compare this month with last month on your own line.
Table of Contents8 sections
- What the call hold time benchmarks say
- How long patients wait on hold before they hang up
- How to measure your own hold time and abandonment
- What moves the number: peaks, callbacks, overflow, automation
- Why a phone-system report and a vendor benchmark disagree
- Where an AI receptionist fits in the hold-time picture
- Set a hold-time target your practice can hit
- Fair questions
A patient calls at 9:10 on a Monday, hears the greeting, and waits. Some share of those callers hang up within a minute or two, and most never call back. Published healthcare reports put the average hold on a connected call at about 4.4 minutes, against a 50-second hold-time standard HFMA published for healthcare call centers.
Call hold time benchmarks come from three kinds of source. Contact-center reports measure what a queue did. Consumer surveys measure what people say they would tolerate. Vendor pages repeat both without saying which is which. This post separates them, shows you how to pull your own figures from the phone system you already have, and matches four levers (staffing at peaks, callbacks, overflow, and an AI receptionist for routine calls) to the pattern in your own report.
What the call hold time benchmarks say
Published benchmarks cluster into a few numbers. Contact-center guidance sets an average speed of answer of 30 to 60 seconds, a service level of 80% of calls answered within 20 seconds, and an abandonment goal under 5%. Healthcare reports put actual average hold at about 4.4 minutes and actual abandonment near 7%.
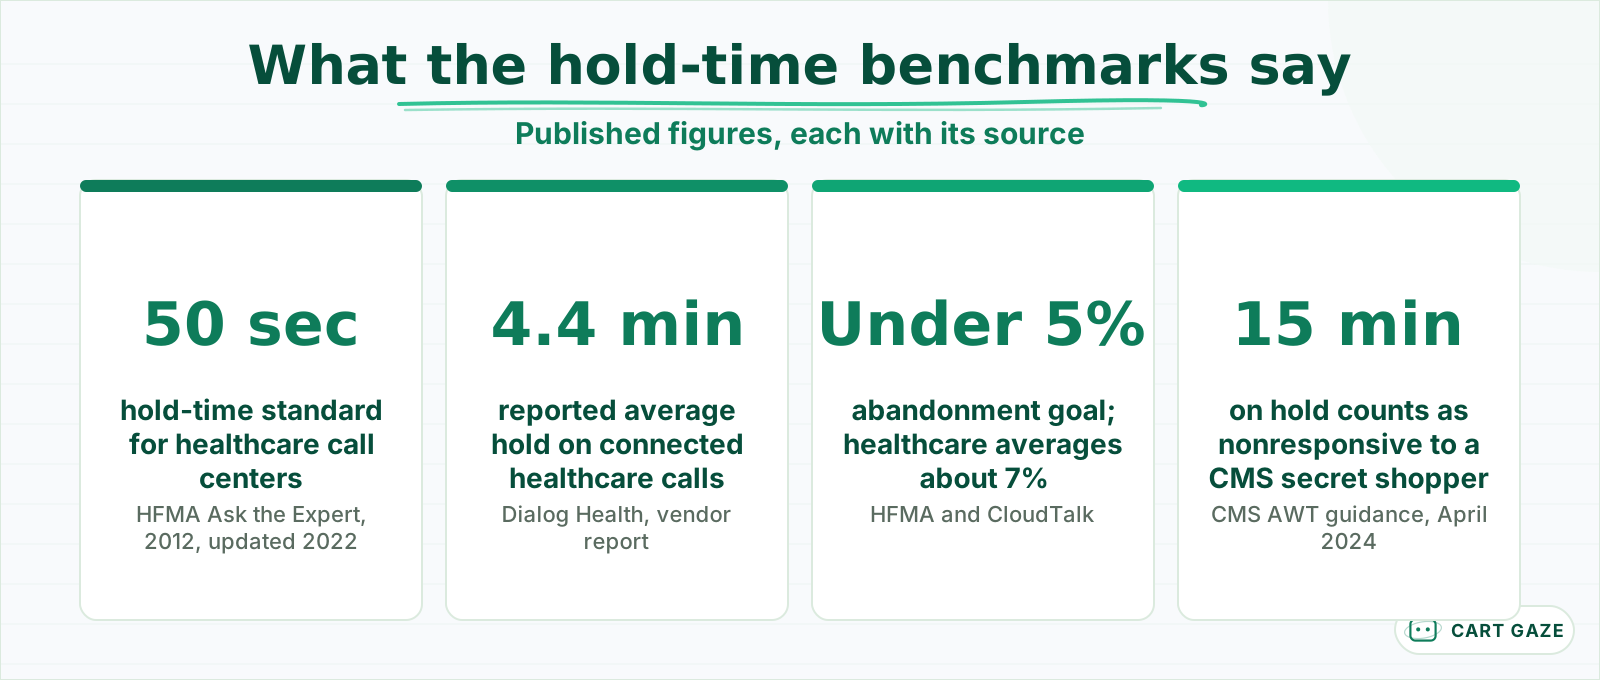 Published figures, each with its source. Ceilings from call centers, not grades for a 3-person desk.
The most-repeated healthcare figure, a 50-second hold-time standard attributed to HFMA, traces to an HFMA "Ask the Expert" answer by a revenue-cycle consultant, first published in 2012 and updated in 2022. The same answer gives general industry figures of a 67-second average wait, 7% average abandonment, and a goal under 5%. Fewer pages repeat that he set a healthcare abandonment standard of 15%, because patient calls run longer than collection calls.
Vendor pages from 2025 and 2026 broadly agree. Dialog Health reports a healthcare average speed of answer of 3 minutes 22 seconds and an average hold of 4.4 minutes on connected calls. Assort Health, citing a 2024 Healthcare Contact Center Times survey, puts the typical center at 5% to 6% and leading hospital scheduling teams near 2%.
The one number with a public system behind it is the VHA's mandated primary-care telephone standard, described in a 2022 Journal of General Internal Medicine study: an average speed of answer of 30 seconds or less and abandonment under 5%. Those are targets for dedicated call centers, not a 4-person front desk.
Important
Every figure above describes a call center or a large access team. Public abandonment benchmarks rarely break out by specialty, and none measured a single-location practice with 2 or 3 people answering between patients. Treat them as a ceiling on "good," not a grade for your desk.
How long patients wait on hold before they hang up
Healthcare vendor pages say most callers quit within 1 to 2 minutes; a general consumer survey says most last far longer. Both are real findings about different things. Queue data from healthcare centers shows abandonment accelerating after 60 seconds, while surveyed consumers report tolerating 5 to 8 minutes when they are the ones estimating.
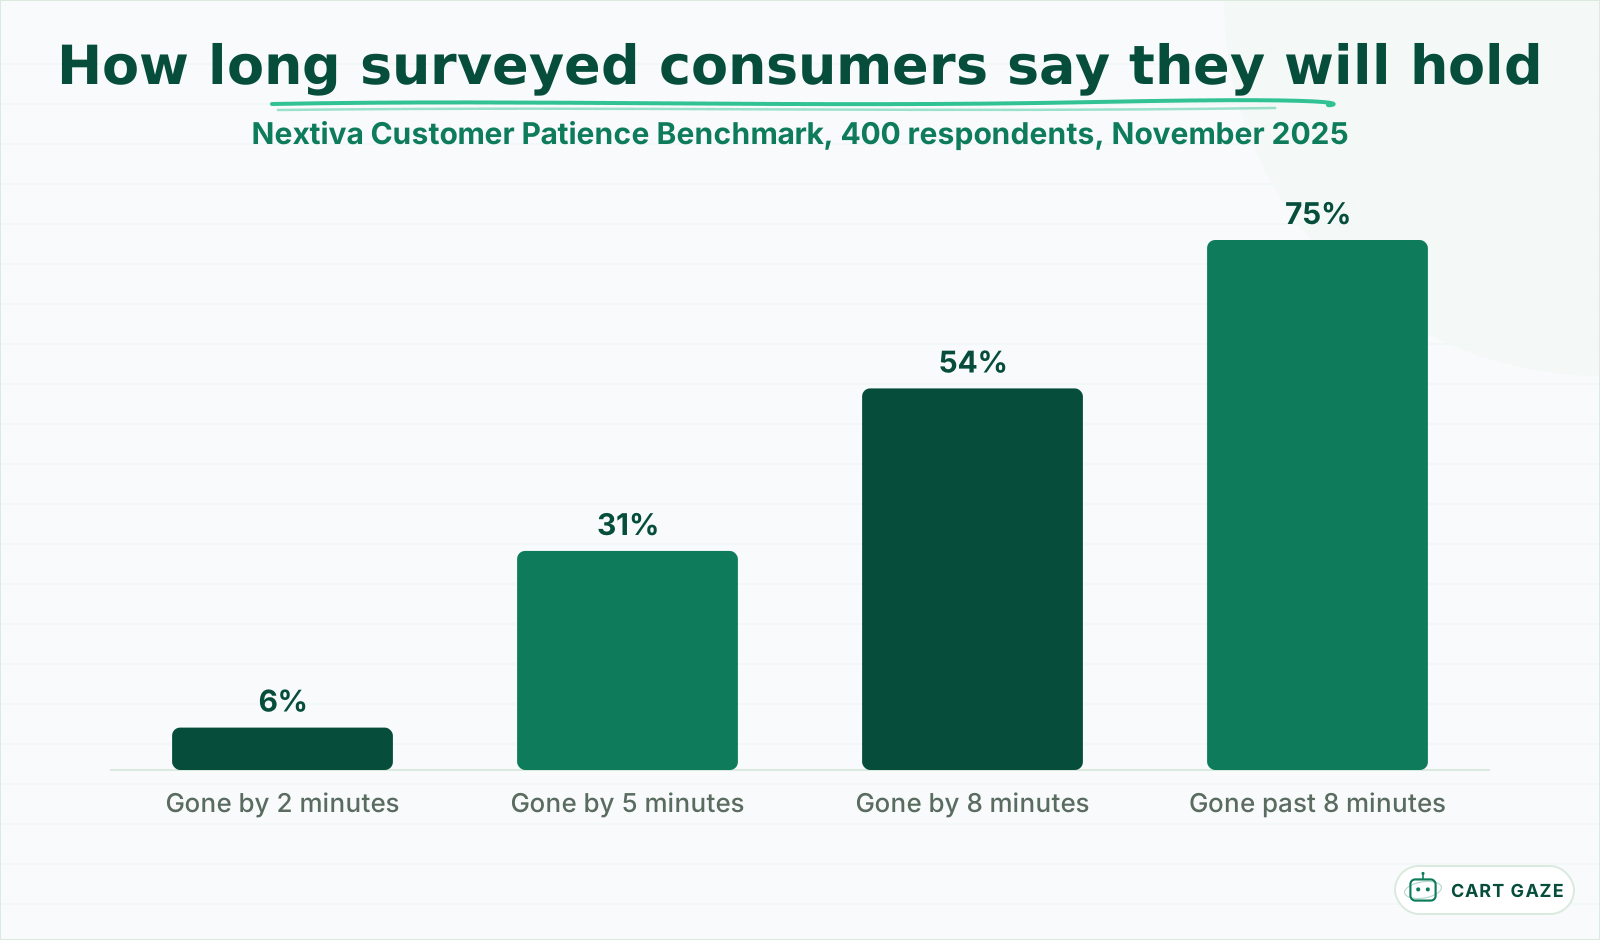 Self-reported patience from a 400-person consumer survey. Healthcare queue data quits much sooner.
Nextiva's Customer Patience Benchmark survey, 400 respondents published in November 2025, found that only 6% of people hang up within 2 minutes, 31% tolerate 5 minutes or less, 54% leave within 8 minutes, and 75% hang up once a hold reaches 8 minutes or more. Those are general consumers rating their own patience, not patients in a live queue.
The healthcare figures are harsher and their chains are weaker. Keona Health, NotifyMD, and Patient Prism all state that around 60% of callers hang up after 1 minute on hold, each citing another vendor page rather than a study. Patient Prism, citing a 2026 vendor roundup, says more than 90% are gone by 5 minutes. One aggregator attributes 34% at 2 minutes and 67% at 5 minutes to an Accenture consumer survey; we could not open the primary, so treat it as directional.
Sprinklr's 2025 statistics piece puts the typical abandonment spikes at 30 and 60 seconds, and a Gartner survey reported by CX Dive found about 1 in 4 customers give up entirely when a hold runs too long. Whatever the exact curve, the first minute is where a practice loses most of the callers it will lose. We work through what each hang-up costs in the real cost of missed calls.
How to measure your own hold time and abandonment
Your phone system already records this. Open the call queue report, not the per-user missed-call report, and pull 4 weeks of data. You want calls offered, calls answered, calls abandoned, average time to answer, and average wait before abandonment, then the same numbers by hour and weekday so peaks stop hiding inside averages.
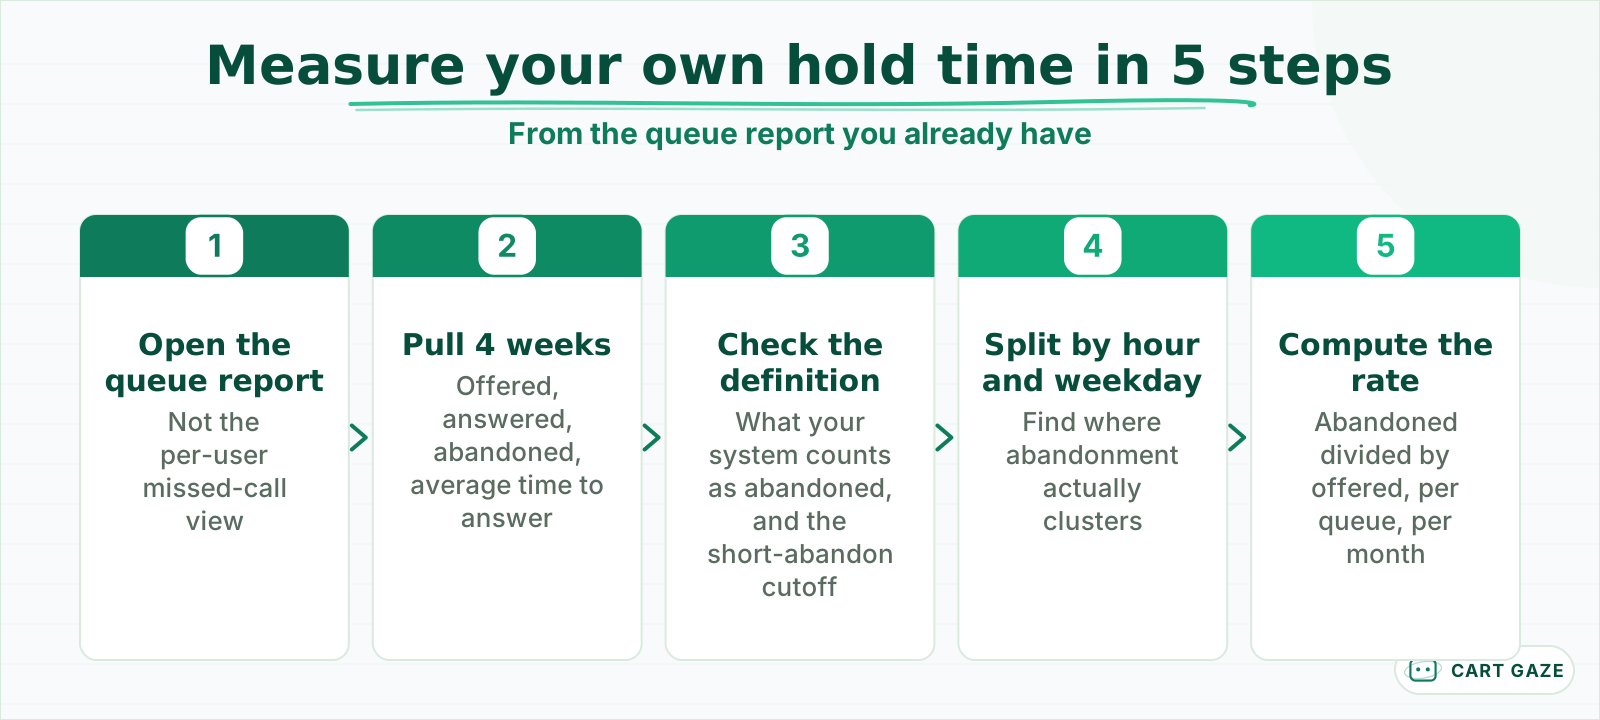 Same report, same definitions, 4 weeks at a time. Averages hide the hour that is losing the calls.
The label matters. RingCentral counts a call as abandoned only when it waited in a queue and was hung up before an answer or voicemail; a call on an individual extension can only be "missed." The number lives under Performance Reports, in the Calls section, filtered to queues. 8x8's queue analytics list offered, answered, abandoned, missed, average time to answer, and average waiting time, and count a hang-up inside voicemail as abandoned.
Abandonment rate is abandoned divided by offered. Write down which definition your system uses before comparing it with anything published, because hold time strictly means time parked after a person has answered, and many small-practice reports fold it into "waiting time."
| Metric | What it counts | Where to find it | Published reference point |
|---|---|---|---|
| Average speed of answer | Seconds from queue entry to a live answer | Queue report, average time to answer | 30 to 60 seconds; VHA target 30 seconds or less |
| Service level | Share of calls answered within a set time | Queue report, if offered | 80% within 20 seconds |
| Abandonment rate | Abandoned divided by offered, per queue | Queue report, abandoned and offered columns | Goal under 5%; healthcare average about 7% |
| Average hold time | Time parked after a live answer | Per-call hold field, if recorded | 50-second HFMA standard; 4.4 minutes reported |
| Longest wait | The worst single wait in the period | Sort the queue export by wait | 15 minutes on hold is nonresponsive to a CMS secret shopper |
That last row deserves a look. The CMS secret shopper guidance for marketplace health plans, issued in April 2024, classifies a provider as nonresponsive if the phone rings for 5 minutes unanswered, if a business-hours voicemail picks up, or if the shopper is held for more than 15 minutes. It is a plan-network standard, not a patient-experience one, but it is the only hold threshold here that a federal agency wrote down. These metrics sit inside the wider set in the front desk call metrics worth tracking.
What moves the number: peaks, callbacks, overflow, automation
Four levers move hold time, and each fits a different pattern in your report. Staffing at peaks fixes abandonment concentrated in 2 or 3 hours. A callback offer fixes long waits nobody can staff away. Overflow answering catches the surge. An AI receptionist takes routine calls out of the queue so humans handle the rest.
Start with the hour-by-weekday view. Most practices find abandonment lives in the first hour of the day, the hour after lunch, and Mondays; one vendor page puts about 38% of daily calls in the first and last hours of operation. If abandonment is 12% at 8 a.m. and 2% at 2 p.m. you have an 8 a.m. problem, and shifting one start time is cheaper than any software.
Callbacks come next. In Nextiva's 2025 survey, 75% of respondents said they always prefer, or at least want, a scheduled callback instead of waiting on hold. Most cloud phone systems, and dental platforms such as Weave, can offer one automatically once a wait passes a threshold you set.
Tip
A callback moves work rather than removing it. Track callbacks completed within the promised window as its own line, because a callback that never happens is a missed call with a worse story attached.
Overflow answering, a live service that takes what the queue cannot absorb, protects the busiest 20 minutes of the day without hiring for them, though a message-taking service rarely books, so a call that needed a slot still comes back to your desk.
The fourth lever earns its place only on the routine share of the queue: bookings, reschedules, hours, directions, and refill status. Those are most calls in most practices, and the ones an AI receptionist can answer and complete without holding anyone. Every clinical or urgent call must route to a person, and the system must never assess symptoms or offer medical advice.
Why a phone-system report and a vendor benchmark disagree
They measure different things, so they should disagree. Your queue report counts real calls on one line, with your definitions and your short-abandon rules. A vendor benchmark averages hundreds of centers, often large ones, with someone else's definitions. Comparing the two tells you less than comparing this month against last month on your own line.
Four gaps explain most of it. Population: the HFMA answer and the HCCT survey describe access centers handling thousands of calls a day; your desk handles 60 to 150. Denominator: some reports divide abandons by all inbound calls, others by queued calls, and a direct-dial practice with no queue can show 0% abandonment while missing a third of its calls. Clock: counting from the greeting runs longer than counting from the end of the menu. Short abandons: a wrong-number hang-up in the first few seconds inflates a rate that excludes nothing.
Then there is the vendor incentive. A page selling callbacks cites the 60%-in-one-minute figure; one selling an answering service cites the 85% who never call back; one selling AI cites the 23% of calls that go unanswered. None is fabricated, but each is chosen. When a benchmark page does not name a primary source you can open, use it to frame a question, not to set a target. If your queue abandons 14% of calls and leading teams sit near 2%, the gap is real; whether it is Monday mornings or a phone tree, only the report can say.
Where an AI receptionist fits in the hold-time picture
An AI receptionist lowers hold time by shrinking the queue rather than answering it faster. Routine calls, which are most of the volume, get answered and completed on the first ring without touching staff. The calls left for humans are fewer and more important, so average speed of answer falls without adding a person.
The system can sit ahead of the queue, answering every call and transferring what it may not handle to your desk with the caller's name and reason attached, or beside it as overflow, picking up only what has waited past a threshold. The first moves more volume; the second is easier to pilot for 30 days.
Warning
An AI receptionist routes clinical, urgent, or distressed callers to a human and never assesses symptoms, advises on medication, or decides how sick someone is. If a configuration cannot guarantee that transfer, it is not ready for a patient line, whatever it does to your hold time.
Two caveats. Vendor pages claim large abandonment drops from AI answering; we have not seen an independent measurement for a small practice, so treat those as claims to test on your own line for 30 to 60 days. And a system that answers instantly but cannot complete the task only relocates the wait to a callback or a transfer. What it can and cannot do on a live call, including where it hands off, is set out in what an AI receptionist does and where it stops.
Before you set a hold-time target
- Your queue report and your benchmark use the same definition of abandoned.
- You have the rate by hour and weekday, not only the monthly average.
- Short abandons under a few seconds are excluded, and the cutoff is written down.
- Every clinical or urgent call has a human path that does not depend on the queue.
Set a hold-time target your practice can hit
A workable target for a small practice is an abandonment rate under 5% of queued calls, most calls answered within 60 seconds, and no caller waiting past 3 minutes without a callback offer. Set it from your own 4-week baseline, pick the lever your peaks point to, and re-measure monthly.
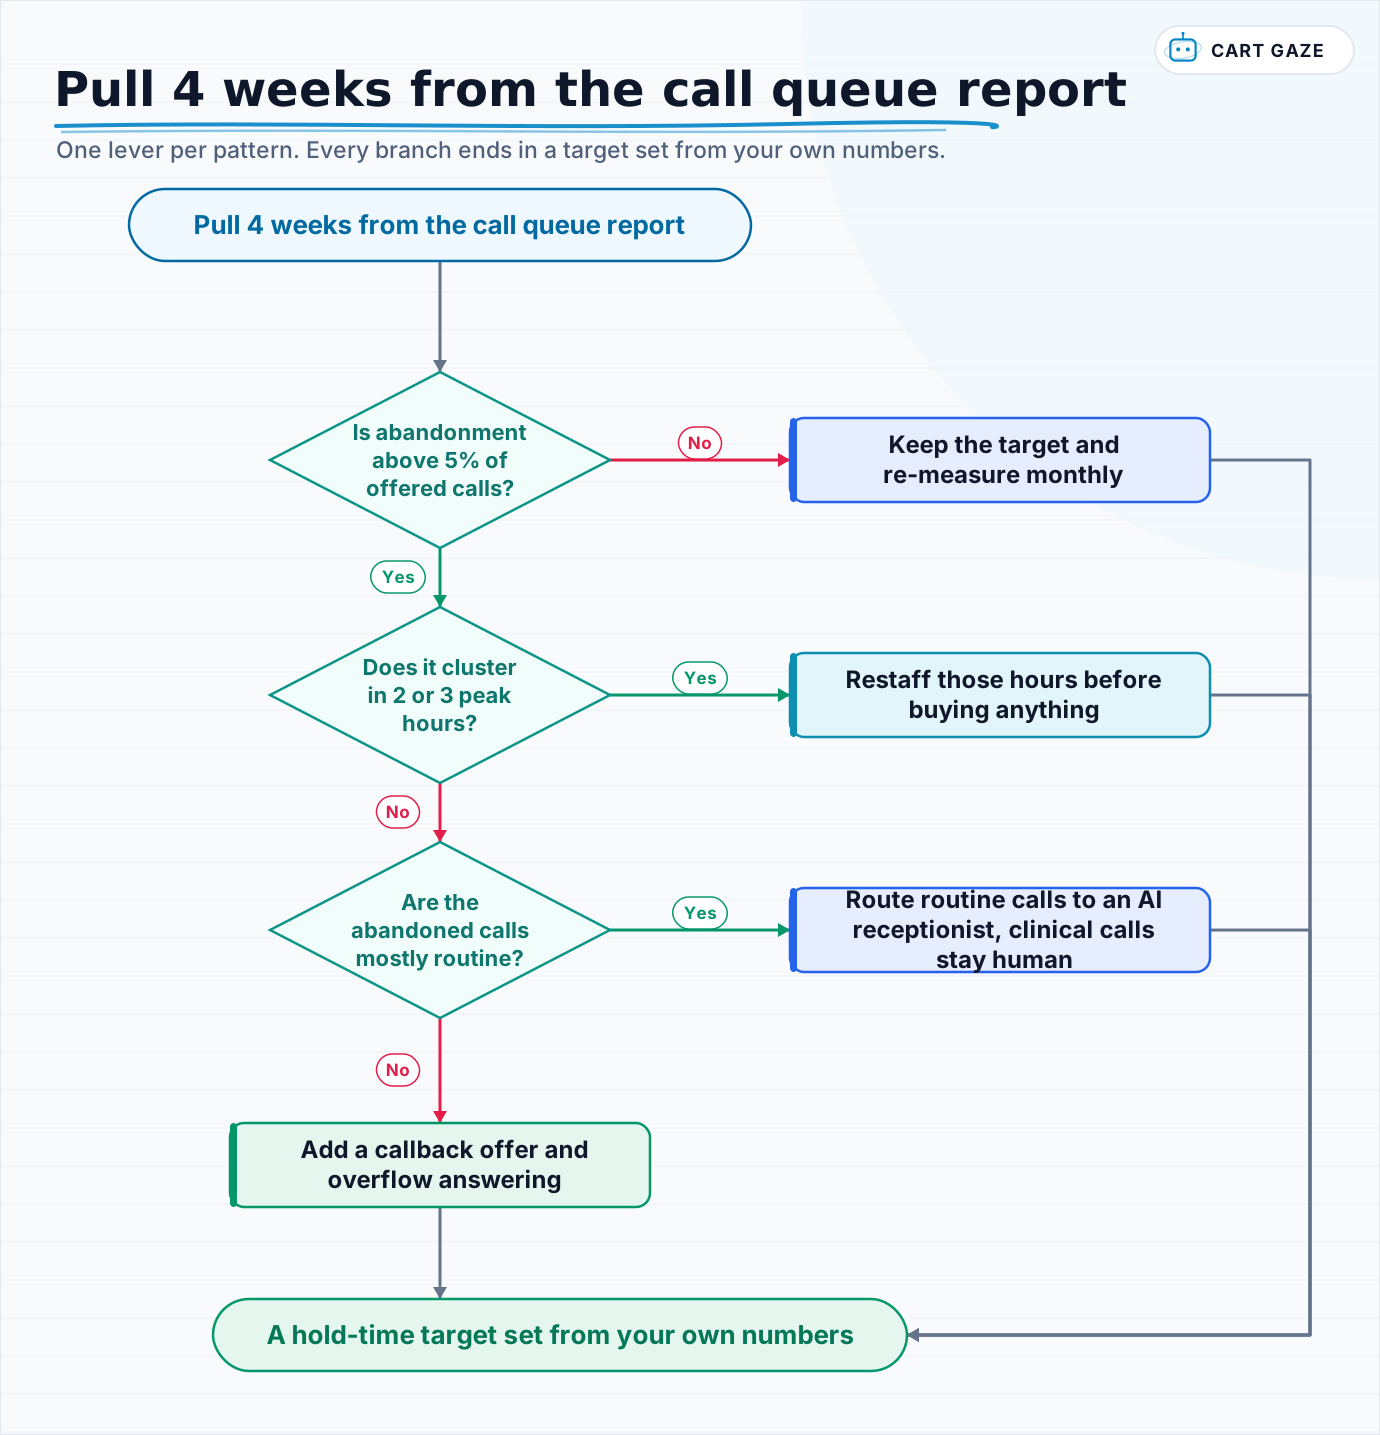 One lever per pattern. Every branch ends in a target set from your own numbers.
Walk the flow with the report open. Under 5%: keep the target and check it monthly. Clustered in 2 or 3 hours: restaff them before buying anything. Spread across the day and mostly routine: move those calls to an AI receptionist and keep humans on the rest. Mostly complex or clinical: a callback offer plus overflow answering is the safer fix.
Whichever lever you pull, the measurement stays the same: the queue report, 4 weeks at a time, with the same definitions. To see how the routine share of a queue gets handled, what an AI receptionist does on a live call walks through a booking, a transfer, and a hand-off to a human.
Fair questions.
How long will a patient wait on hold before hanging up?
It depends on who is measuring. Healthcare vendor pages report that around 60% of callers hang up after 1 minute, though each cites another vendor page. Nextiva's 2025 survey of 400 consumers found only 6% quit within 2 minutes and 75% quit once a hold passes 8 minutes. Contact-center data shows abandonment spiking at 30 and 60 seconds, so treat the first minute as the danger zone.
What is a good call abandonment rate for a medical office?
Contact-center guidance sets a goal under 5% of queued calls, and healthcare averages about 7%. Leading hospital scheduling teams get close to 2%, and the VHA mandates under 5% with a 30-second average speed of answer. Those numbers describe call centers, so for a small practice, use them as a ceiling and track your own rate by hour and weekday instead.
How do I measure hold time and abandonment from my phone system?
Open the call queue report rather than the per-user missed-call view. RingCentral shows abandoned calls under Performance Reports, filtered to queues; 8x8 lists offered, answered, abandoned, and average time to answer. Pull 4 weeks, divide abandoned by offered, and break the result out by hour and weekday. Write down your system's definition of abandoned before comparing it with any published figure.
Does offering a callback reduce call abandonment?
It usually flattens the abandonment curve past the point where the offer is made, and callers want it: 75% of respondents in Nextiva's 2025 survey said they prefer or at least want a scheduled callback over waiting on hold. The catch is that a callback moves work rather than removing it, so track callbacks completed within the promised window as a separate metric.
Can an AI receptionist reduce hold time at a medical practice?
It can shrink the queue by answering and completing routine calls, such as bookings, reschedules, hours, and refill status, so the calls left for staff are fewer and average speed of answer falls. It must route every clinical, urgent, or distressed caller to a human and never assess symptoms. Vendor claims of large abandonment drops are unverified for small practices, so pilot it for 30 to 60 days.
Sources.
- [1]HFMA Ask the Expert: setting industry standards for call center activities
- [2]Dialog Health: healthcare call center statistics (hold time, ASA, abandonment)
- [3]CloudTalk: healthcare call center benchmarks
- [4]Patient Prism: average call abandonment rate in healthcare, 2026 benchmarks
- [5]Keona Health: missed calls and call abandonment in healthcare
- [6]Assort Health: call abandonment rate in healthcare and how to improve it
- [7]NotifyMD: how long should patients wait on hold
- [8]Nextiva Customer Patience Benchmark survey, November 2025
- [9]Sprinklr: call center statistics 2025
- [10]CX Dive: why more contact centers do not offer automatic callbacks (Gartner)
- [11]Telephone access management in primary care: VHA cross-case analysis (J Gen Intern Med, 2022)
- [12]CMS Appointment Wait Time Secret Shopper Survey Technical Guidance (April 2024)
- [13]RingCentral community: how abandoned calls are defined and reported
- [14]8x8 Analytics for 8x8 Work: call queue metrics
- [15]RingRx: 5 call metrics that reveal whether your practice phone system is working
- [16]Weave: how to reduce call abandonment
- [17]AgentZap: medical practice phone statistics (aggregator)
Written by

Muhammad Qasim Hammad
Founder, Cart Gaze
Qasim builds AI receptionists and front-office automation for medical and dental practices at Cart Gaze. Posts here start from published sources and real call data, not vendor claims, and every number links back to where it came from.
Keep reading.
 Missed Calls & Front DeskPatient Callback Requests: How to Offer, Staff and Automate Them10 min read
 Missed Calls & Front DeskCall Volume Forecasting for Your Front Desk: Staff the Peak11 min read
 Missed Calls & Front DeskFront Desk Call Metrics Every Practice Should Track in 202610 min read
 Missed Calls & Front DeskPrescription Refill Automation That Keeps Providers in Control10 min read
 Missed Calls & Front DeskAfter-Hours Call Handling: Cover the 41% Nobody Answers11 min read
 Missed Calls & Front DeskFront Desk Burnout: What Automation Fixes, and Does Not9 min read