
No-Show Rate Benchmarks by Specialty: What the Studies Show
Published no-show rates run from about 6% to over 20%, and most specialty tables trace to nothing. Here are the benchmarks with real studies behind them, and how to compute your own.
Key takeaways.
- Epic Research put 2024 no-show rates at 6.2% for patients with a portal account and 7.9% without, across 1.6 billion outpatient visits.
- Academic studies run higher: 18.8% across 10 VA clinics, 18.3% in an academic ENT practice, and 21.7% in a resident eye clinic.
- Rates vary as much within a specialty as between them; one ENT department ran 12.6% in head and neck clinics and 21.3% in pediatric clinics.
- Lead time is the driver you control: one eye clinic went from 9.1% no-shows at 0 to 2 weeks to 38.3% at 6 months ahead.
- Compute your own rate with late cancels and practice cancellations separated, over 3 months, split by visit type, lead time and provider.
Table of Contents8 sections
Ask five sources for the average no-show rate and you will get five answers between 6% and 23%, most of them repeated without a study behind them. Tables of no-show rates by specialty are the worst offenders: they circulate from vendor blog to vendor blog, and few of the numbers trace to anything you can open. Epic Research, working from more than 1.6 billion outpatient visits in 2024, put the rate at 6.2% for patients with a portal account and 7.9% for those without.
This post collects the no-show rate benchmarks by specialty and setting that do trace to a study, explains why they differ so much, shows which driver you actually control, gives you rules for computing your own rate so it can be compared month to month, and sets out what a realistic target looks like.
What published no-show rates actually say
Published no-show rates run from about 6% in national EHR data to more than 20% in academic and resident clinics, and a review of 105 studies put the average near 23%. The spread is real, but most of it comes from setting, patient mix, and lead time rather than specialty alone.
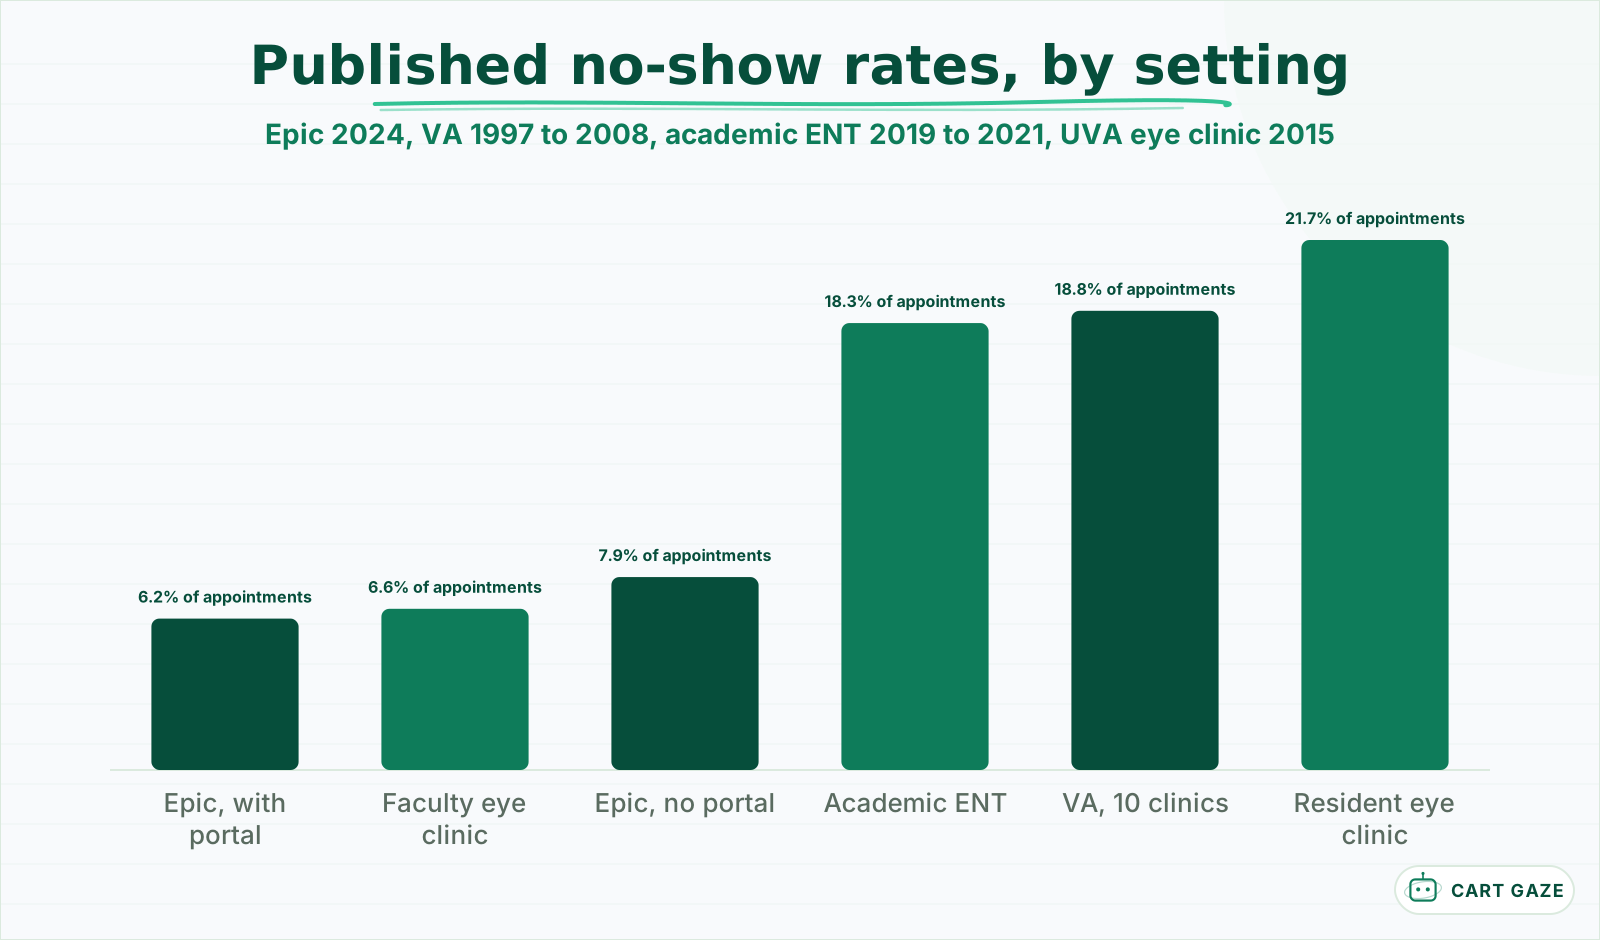 Every bar traces to a named study. Setting explains more of the spread than specialty.
The largest dataset is Epic's: 1.6 billion face-to-face outpatient visits in 2024, with no-show rates of 6.2% for patients with an active portal account and 7.9% for those without. Age mattered more than portal use. Among 18 to 34 year olds, the rates were 9.3% and 10.9%; among 50 to 64 year olds, 6.2% and 8.7%.
Academic studies land higher. A 2016 study of a large VA medical center, covering fiscal years 1997 to 2008 across 10 main clinics, found a mean no-show rate of 18.8%, highest in the subspecialty clinics. An academic otolaryngology practice that reviewed 121,347 scheduled visits from 2019 to 2021 found 18.3% nonattendance. A University of Virginia ophthalmology study of 51,529 appointments found 21.7% in the resident clinic and 6.6% in the faculty clinic, in the same department.
The 2018 systematic review by Dantas and colleagues, which pooled 105 studies from 1980 to 2016, put the average around 23%, ranging from 13.2% in Oceania to 43.0% in Africa. It is the number most often quoted, and it is also the least like a typical US private practice, because published studies cluster in clinics that already had a no-show problem worth studying.
Two gaps are worth naming. We did not find an open, primary study giving a clean rate for private dental practices or for outpatient behavioral health practices, the two specialties practices ask about most. The figures in circulation for both come from vendor roundups, so treat them as a rumor of a range rather than a benchmark.
Important
Be wary of tidy tables that give one no-show rate per specialty. We could not trace most of the figures in circulation to a study, and the studies that exist show rates varying as much within one specialty as between specialties.
Why no-show rates differ so much between specialties
Specialty matters less than who is booked, how far ahead, and into which clinic. The same academic otolaryngology department ran 12.6% in head and neck clinics and 21.3% in pediatric clinics. The same ophthalmology department ran 6.6% in faculty clinics and 21.7% in resident clinics. Patient mix and scheduling drive the gap.
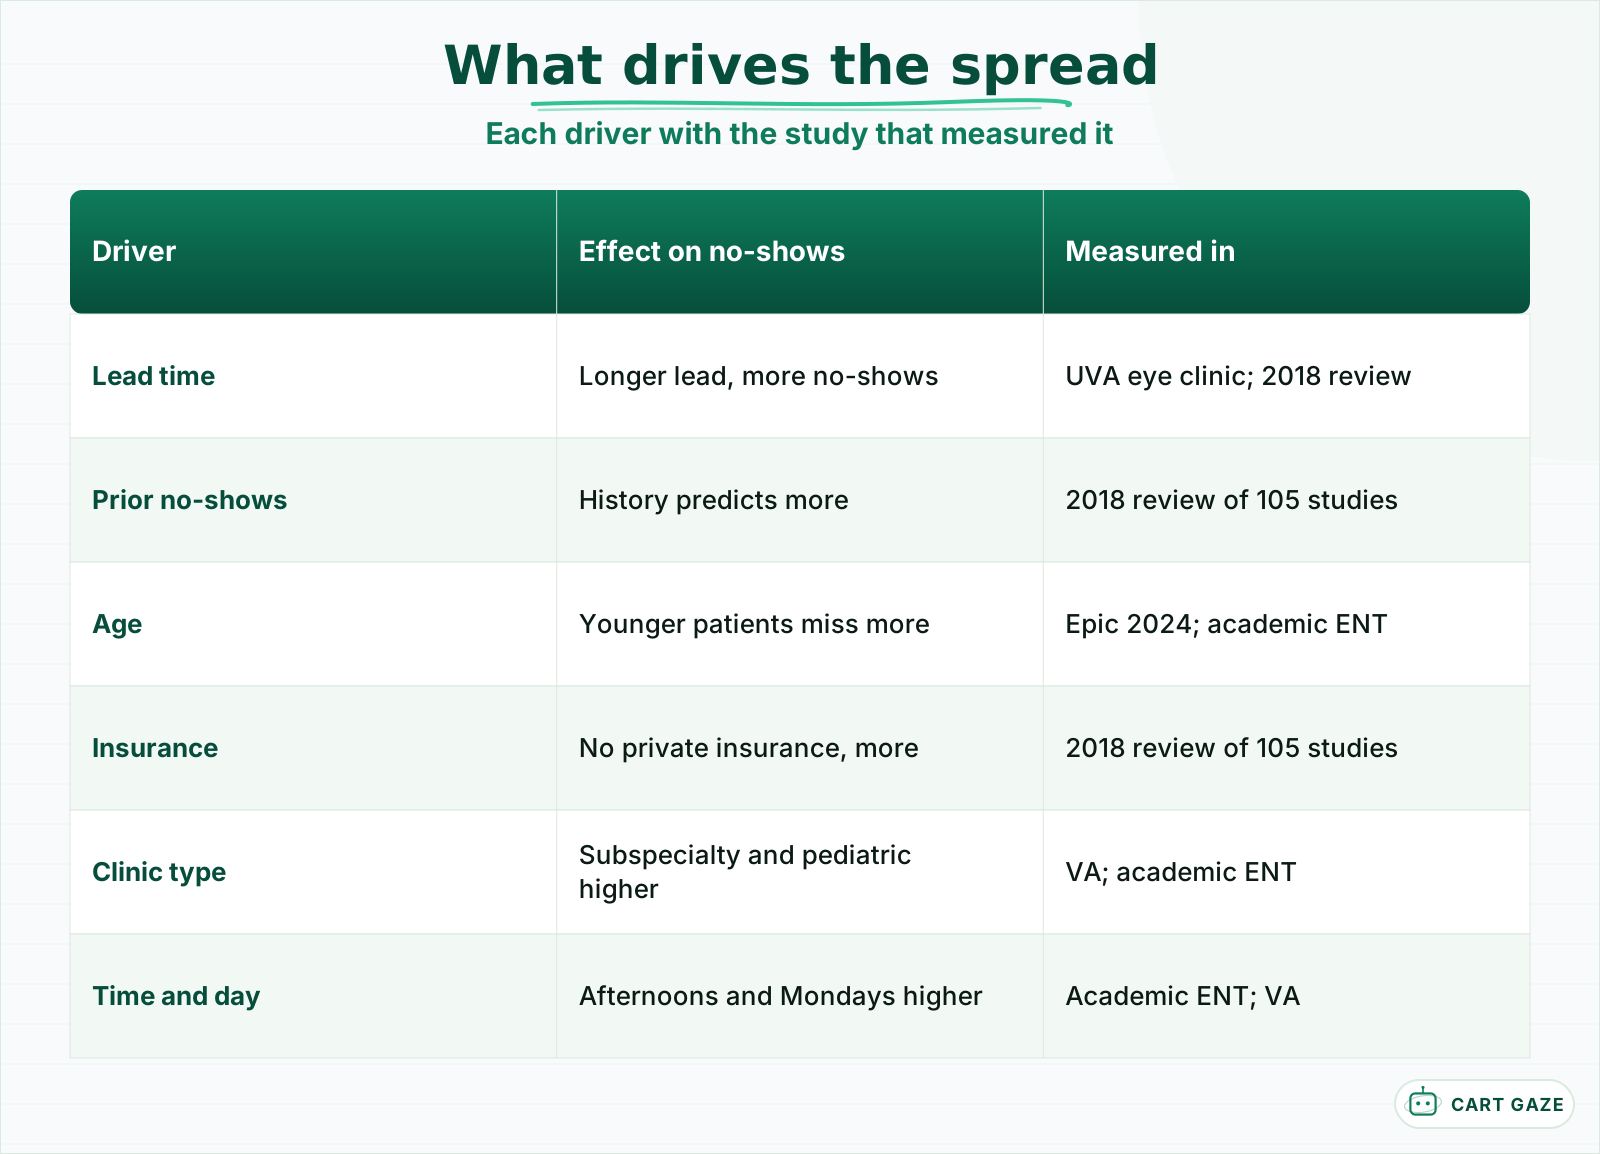 Each driver varies with a specialty patient mix, which is why specialty averages mislead.
The Dantas review found the same determinants again and again: longer lead time and a history of prior no-shows were the most commonly significant, and younger adults, patients with lower socioeconomic status, patients living far from the clinic, and patients without private insurance missed more often. Every one of those varies by specialty's patient mix, which is why a behavioral health practice and a faculty eye clinic can sit 15 points apart without either being badly run.
Clinic type shows up inside single systems too. In the VA study, the women's clinic had a higher no-show rate and the geriatric clinic a lower one than general primary care, and Mondays ran highest across the week. In the otolaryngology study, afternoon appointments and online self-scheduling were both associated with more nonattendance.
So the useful comparison is not "our specialty's average." It is your rate against your own rate for the same segment: new versus established patients, one provider versus another, same-week versus long-lead bookings.
Lead time is the driver you control
Of all the drivers, lead time is the one a practice can change. In the Virginia eye clinic, resident-clinic no-shows ran 9.1% for appointments booked within 2 weeks and 38.3% for appointments booked 6 months ahead. The authors modeled a drop of about 2% for every 10% more patients booked within 2 weeks.
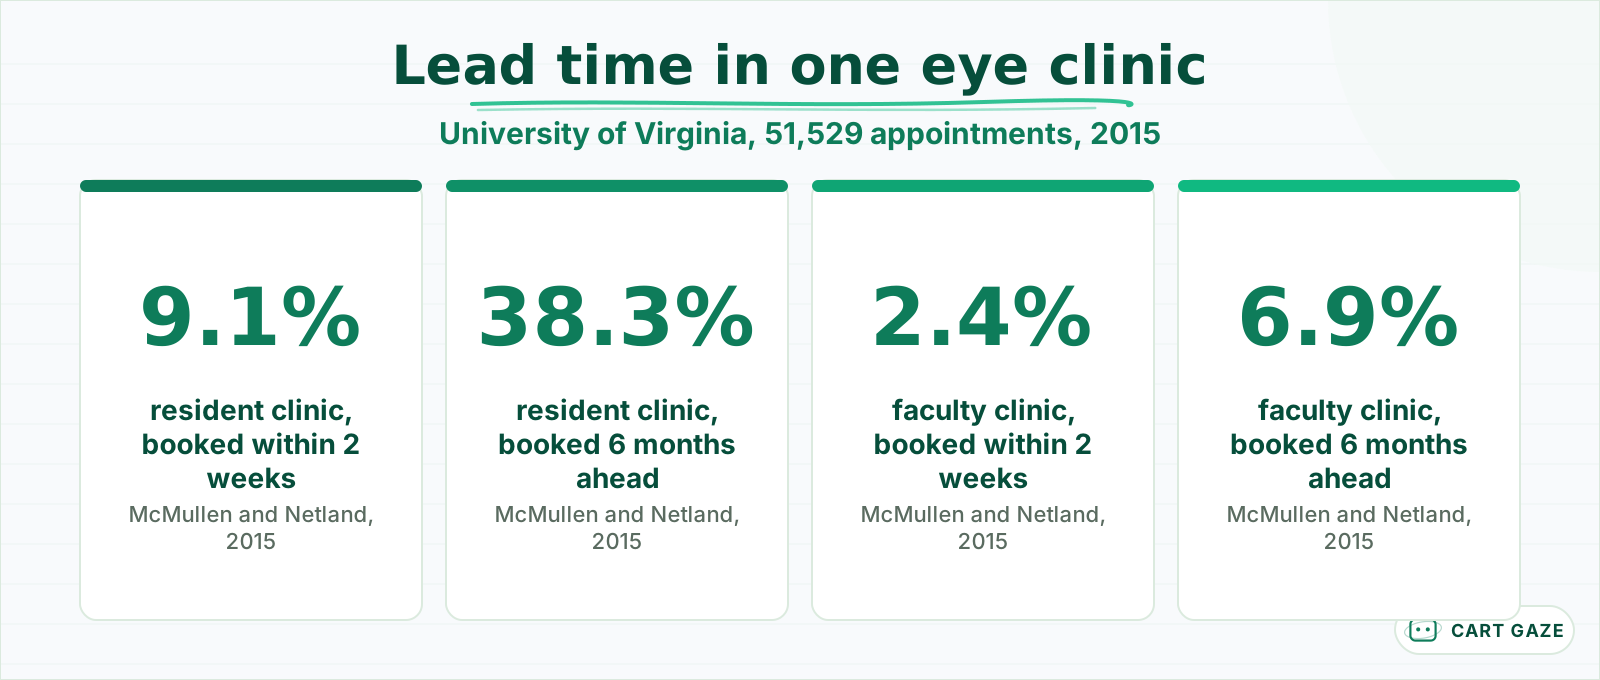 Same department, same year. The further ahead the booking, the more it is missed.
The faculty clinic showed the same direction on a smaller scale, from 2.4% at 0 to 2 weeks to 6.9% at 6 months. Recall appointments set a year out, follow-ups booked at checkout for "3 months from now," and new patients queued for a first opening weeks away all carry the long-lead risk.
Two practical moves follow. Book long-lead follow-ups as a recall reminder that prompts the patient to schedule nearer the date, rather than as a fixed slot that will be forgotten. And protect some near-term capacity so new patients are not pushed 5 or 6 weeks out, which is the booking most likely to be missed.
The reminder playbook itself, and how much reminders move the rate, is covered in how to reduce patient no-shows. The VA study is a useful caution there: a centralized phone reminder moved its rate only from 16.3% to 15.8%.
How to compute your own no-show rate
Compute it as appointments where the patient did not arrive and did not cancel, divided by all appointments still on the schedule at the start of the day. Track late cancellations separately, leave out practice-initiated cancellations, and cut the rate by provider, visit type, and lead time. A single blended number hides the segment worth fixing.
| Situation | Count it as | Why |
|---|---|---|
| Did not arrive, no contact | No-show | The core event |
| Cancelled under 24 hours before | Late cancel, tracked separately | Different cause, different fix |
| Arrived too late to be seen | No-show, if your policy says so | Write the rule down and keep it |
| Cancelled or moved by the practice | Excluded | Not the patient's behavior |
| Rescheduled days in advance | Excluded | The slot could be refilled |
Pull at least 3 months, because a single month swings with holidays, weather, and flu season. Then split it at least three ways: new versus established patients, lead time under and over 2 weeks, and by provider. Most practices find one segment carrying a large share of the misses.
As an illustration, suppose 1,200 appointments were on the schedule at the start of the day over 3 months, and 96 patients neither arrived nor cancelled. The rate is 8.0%. Now suppose 60 of those 96 came from the 400 appointments booked more than 30 days ahead. That segment runs 15%, while the other 800 appointments run 4.5%. The blended 8.0% looked ordinary; the split shows where the problem lives.
Tip
Put the no-show rate for bookings made more than 30 days ahead next to the rate for bookings made within 2 weeks. If the gap is large, your fix is scheduling, not reminders.
What a realistic no-show target looks like
A realistic target is a reduction in your worst segment, not a match for a published average. If long-lead bookings miss twice as often as short-lead ones, aim to shorten lead times there first. Most practices are holding steady: 73% in MGMA's August 2025 poll said their no-show rate was flat or down.
That MGMA poll, 265 responses, found 60% of practices reporting no-show rates unchanged in 2025 against 2024, 13% reporting a decrease, and 27% an increase. A practice whose rate is flat is normal; one whose rate is flat at 18% with a 35% long-lead segment has an obvious place to start.
Judge progress against the same months of the prior year where you can. December, the weeks around school holidays, and a bad flu season all move the rate for reasons no scheduling change will touch, and a month-on-month comparison across them can make a real improvement look like a failure.
Cost gives the target its weight. The VA study estimated the average cost of a no-show at $196 per patient in 2008, and a private practice's number depends on visit value and whether the slot could be refilled. Scoring each appointment's no-show risk and overbooking against it is a separate technique, covered in no-show prediction and smart overbooking.
Where automation and an AI receptionist fit
Automation helps in three places: making it easy to cancel instead of simply not showing, refilling a cancelled slot quickly, and keeping patients connected through a portal. An AI receptionist handles the first two on the phone, at any hour. It cannot change lead time or patient mix; scheduling rules do that.
A patient who cannot reach you to cancel becomes a no-show. An AI receptionist that answers every call, including early mornings and evenings, turns some of those into cancellations and reschedules, and it can offer the freed slot to a patient on your waitlist. What it does and where it stops is set out in what an AI receptionist does and where it hands off.
Portal activation is worth pushing for its own sake. In Epic's 2024 data, patients with an active portal account were 21.5% less likely to no-show, though portal users also differ from non-users in other ways, which the study's sensitivity analysis tried to account for.
It must route every clinical, urgent, or distressed caller to a person and never assess symptoms or give medical advice. A patient calling to cancel because they feel too unwell to come in may need a clinician more than a new slot.
Before you compare your no-show rate to anyone's
- Late cancels and practice cancellations are counted separately.
- The rate covers at least 3 months.
- It is split by new and established, lead time, and provider.
- The benchmark you compare against names its setting and year.
Set your no-show benchmark
Set your benchmark from your own data: compute the rate with fixed rules, split it by segment, and find the worst one. Compare published figures only with settings like yours, and treat any specialty table without a source as decoration. Then change one driver, most often lead time, and re-measure.
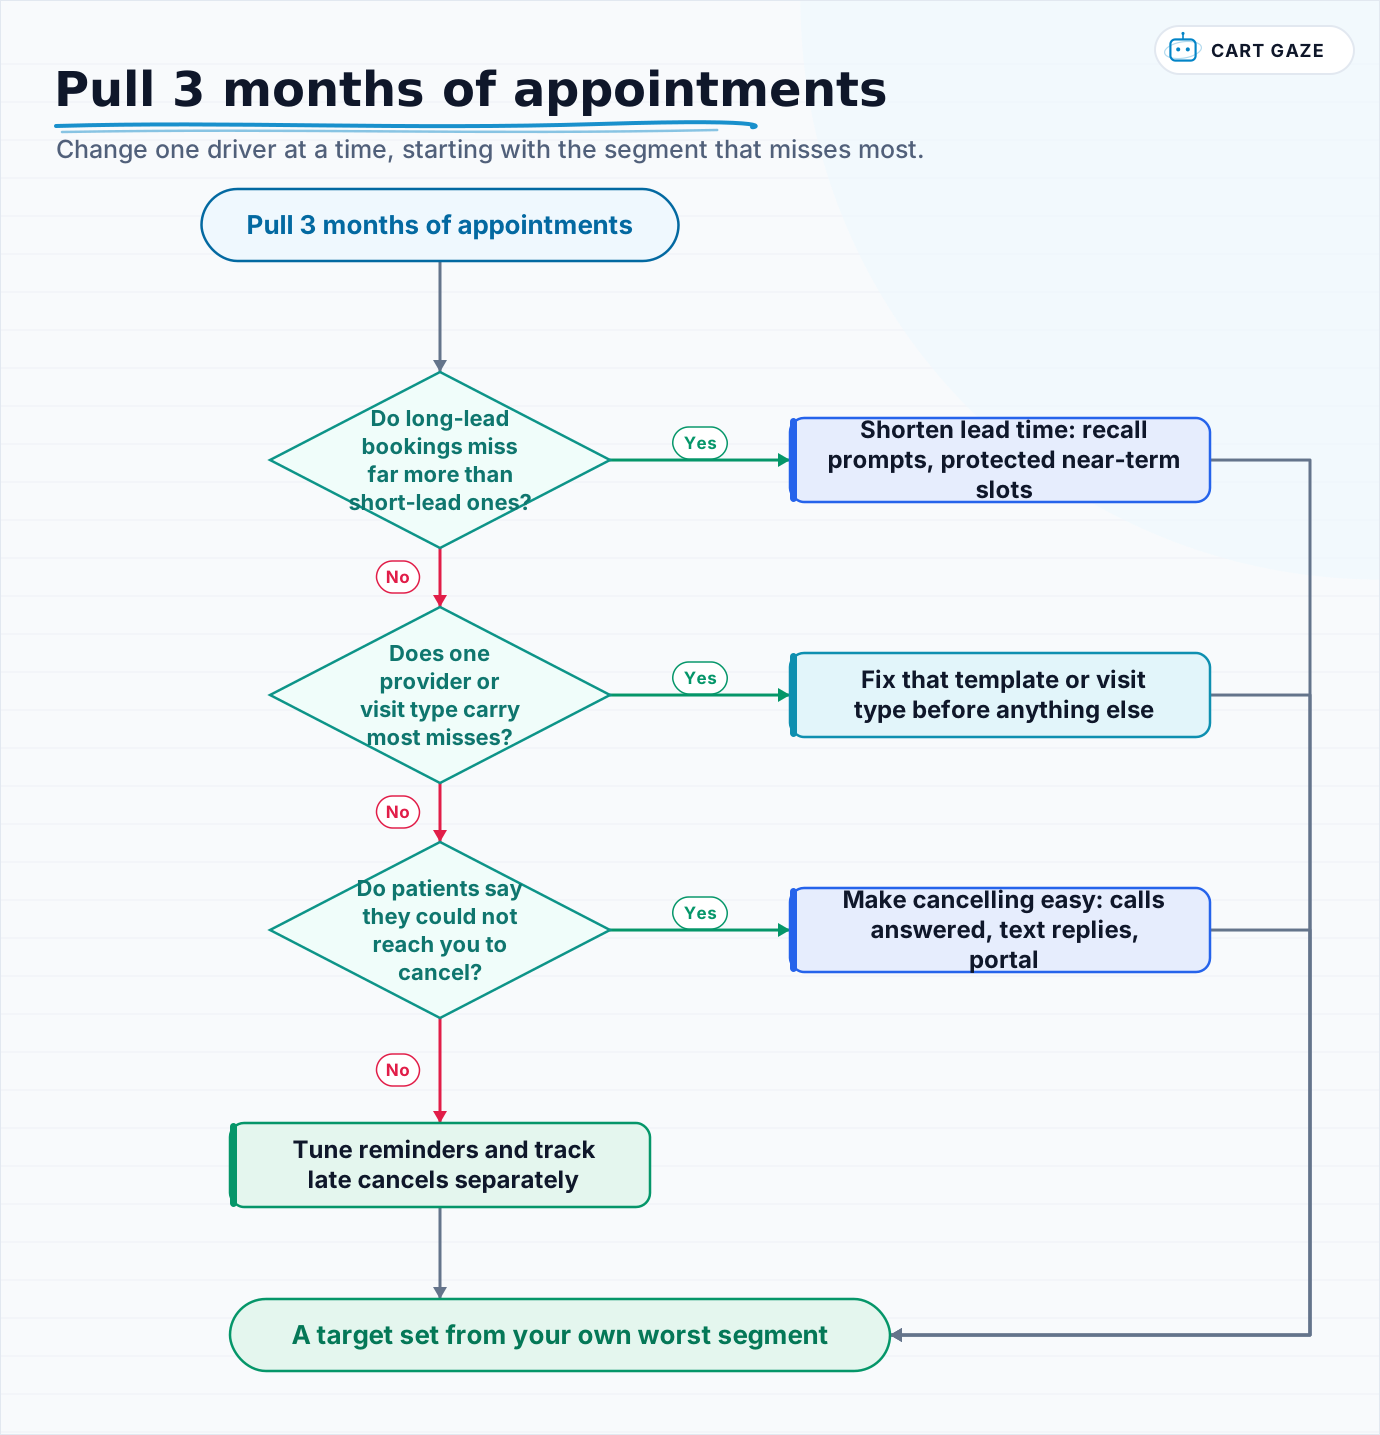 Change one driver at a time, starting with the segment that misses most.
Walk the flow with 3 months of your own appointments open. Most practices end up at lead time or at a single provider's template, and both are fixable without buying anything.
How reminder and confirmation texts run day to day, with opt-out enforced by the system, is set out in how patient texting works, and how opt-out is enforced.
Fair questions.
What is the average no-show rate for medical practices?
It depends heavily on the source and setting. Epic Research found 6.2% for patients with a portal account and 7.9% without across 1.6 billion 2024 visits. Academic studies report 18% to 22%, and a review of 105 studies averaged about 23%. Compare yourself with settings like yours, and above all with your own rate over time.
Which specialties have the highest no-show rates?
Published studies point to settings rather than specialty labels: subspecialty clinics in a VA study, pediatric clinics in an academic ENT practice, and resident clinics in an eye department all ran higher than their counterparts. Many per-specialty tables online do not trace to a study, so treat any figure without a named source with caution.
How do you calculate a no-show rate correctly?
Divide appointments where the patient did not arrive and did not cancel by all appointments still scheduled at the start of the day. Count late cancellations separately, exclude cancellations made by the practice, and use at least 3 months of data. Then split the rate by new and established patients, lead time, and provider.
Does booking appointments further ahead increase no-shows?
Yes, consistently. In a University of Virginia ophthalmology study of 51,529 appointments, resident-clinic no-shows rose from 9.1% for bookings within 2 weeks to 38.3% for bookings 6 months ahead. A 2018 review of 105 studies found long lead time and prior no-shows were the most commonly significant predictors.
What is a realistic no-show rate target for a practice?
A reduction in your worst segment, rather than a published average. If long-lead bookings miss twice as often as short-lead ones, shorten lead times there first and re-measure. In MGMA's August 2025 poll, 60% of practices said their rate was unchanged from 2024, 13% said it fell, and 27% said it rose.
Sources.
- [1]Epic Research: patient portal use associated with 21 million fewer visit no-shows in 2024
- [2]Kheirkhah et al. Prevalence, predictors and economic consequences of no-shows (BMC Health Services Research, 2016)
- [3]No-show rates in an academic otolaryngology practice before and during the COVID-19 pandemic (Cureus, 2024)
- [4]McMullen and Netland, Lead time for appointment and the no-show rate in an ophthalmology clinic (Clinical Ophthalmology, 2015)
- [5]Dantas et al. No-shows in appointment scheduling: a systematic literature review (Health Policy, 2018)
- [6]MGMA Stat: patient no-shows in 2025
Written by

Muhammad Qasim Hammad
Founder, Cart Gaze
Qasim builds AI receptionists and front-office automation for medical and dental practices at Cart Gaze. Posts here start from published sources and real call data, not vendor claims, and every number links back to where it came from.
Keep reading.
 No-Shows & Follow-UpAfter a No-Show: The Follow-Up Sequence That Brings Patients Back10 min read
 No-Shows & Follow-UpThe New Patient Welcome Sequence That Gets Them Through9 min read
 No-Shows & Follow-UpNo-Show Prediction: Spot High-Risk Visits Before They Happen10 min read
 No-Shows & Follow-UpRunning Late Text to Patients: When to Send It and What to Say10 min read
 No-Shows & Follow-UpThe Intake Form Completion Chase: Paperwork Done Before Arrival11 min read
 No-Shows & Follow-UpAI Appointment Rescheduling: Make Cancelling Easy On Purpose12 min read