
Speed to Lead Benchmarks Medical Practices Can Actually Measure
The famous 5-minute rule comes from a 2007 study of 6 sales companies, not from patients. Here is what published healthcare response-time data says, and the 4 clocks you can time in your own logs this week.
Table of Contents8 sections
- Where the 5-minute rule came from, and why it is not a healthcare benchmark
- What the published benchmarks actually say, and who published them
- The 4 clocks worth timing on every new-patient inquiry
- How to time your own response by channel, hour, and day
- What counts as an answer, and what counts as a hang-up
- Set a target you can defend, then re-measure
- Pick one clock and start timing it this week
- Fair questions
You have read somewhere that a new-patient inquiry needs an answer within 5 minutes. Nobody tells you where that number came from, whether anyone ever measured it on patients, or what your own practice does today. Most owners cannot answer the third question, which makes the first two academic.
The 5-minute rule traces back to a single study presented at a marketing conference on 16 October 2007. It covered 6 business-to-business companies, more than 15,000 web-form leads, and more than 100,000 call attempts. No patients, no practices, and 19 years ago. It is a real finding. It is not a healthcare benchmark, and the pages that reprint it under a 2026 headline rarely say so.
This post shows where the famous numbers came from and who published them, lists the healthcare response-time figures that actually exist, and hands you 4 clocks you can time in your own logs this week. No product fixes a number you have never produced.
Where the 5-minute rule came from, and why it is not a healthcare benchmark
The 5-minute rule comes from one 2007 study of 6 business-to-business companies, over 15,000 web-form leads, and over 100,000 call attempts. It found that calling at 5 minutes rather than 30 minutes changed the odds of qualifying a lead by 21 times. It measured sales prospects, not patients.
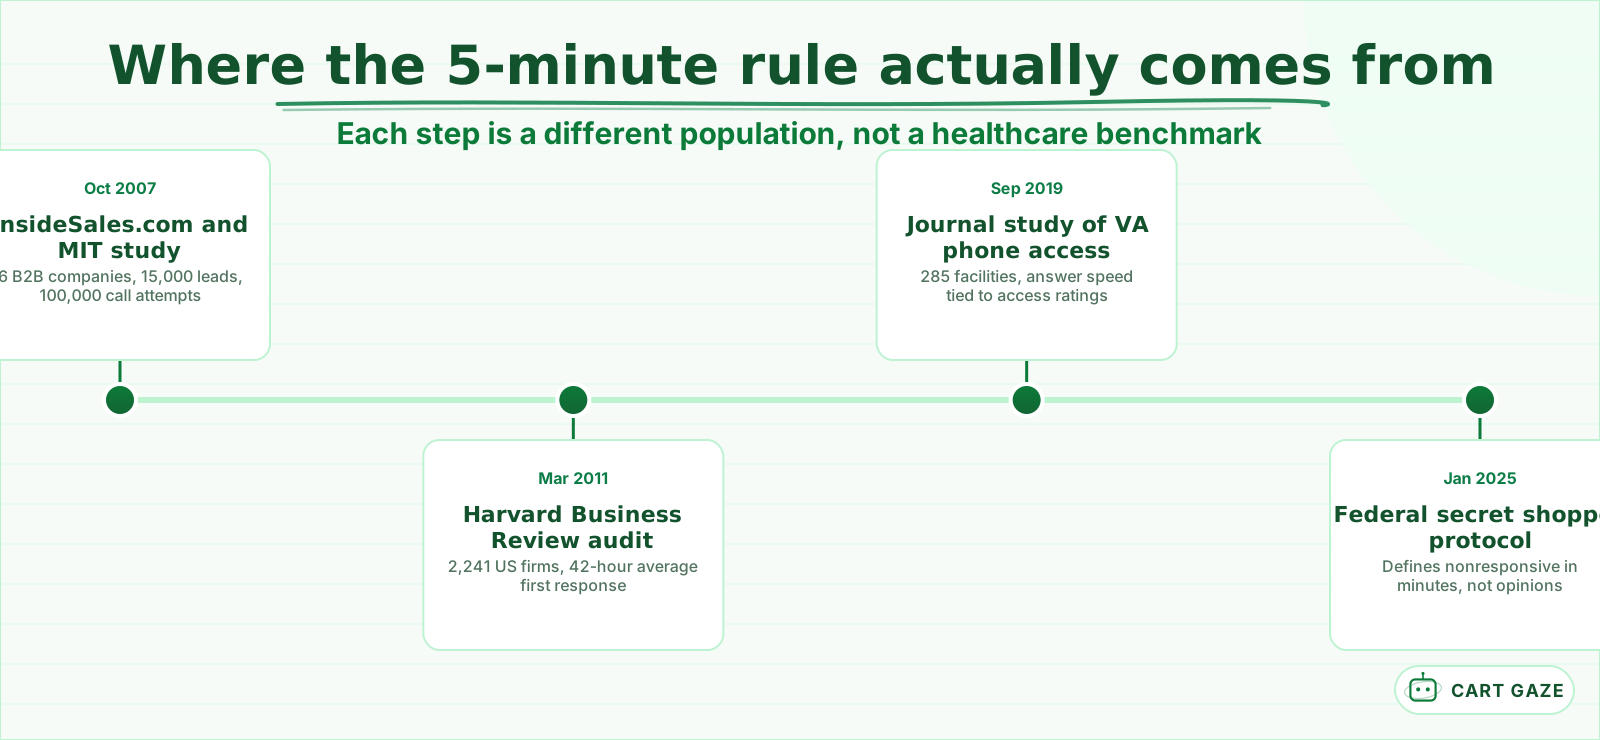 The famous number is 2007 sales data. The healthcare evidence is newer and narrower.
The study was run by Dr James Oldroyd, then at MIT, with InsideSales.com, and presented at MarketingSherpa's B2B Demand Generation Summit in October 2007. Its exact wording is worth reading before you quote it: the odds of contacting a lead called at 5 minutes versus 30 minutes drop 100 times, and the odds of qualifying that lead drop 21 times. Contact odds fall more than 10 times inside the first hour. After 20 hours, the study found extra dial attempts actively hurt.
Three caveats get dropped every time the number is recycled. The population was web-form sales leads at 6 companies, none of them a medical practice. The data is now 19 years old. And the executive summary is copyrighted to InsideSales.com, which sold the callback dialer the finding recommends.
The authors were more careful than the pages that followed. Oldroyd is quoted in that summary saying the patterns show up clearly only when data from several companies is pooled. In other words, the effect is visible across an industry, not guaranteed inside any single office. The underlying logic still holds up, and why the fastest response tends to win a new patient does not depend on the exact multiple.
What the published benchmarks actually say, and who published them
There is no audited speed-to-lead benchmark for medical practices. What exists is a 2011 audit of 2,241 companies outside healthcare, one small analysis of 11 elective practices, and a peer-reviewed study of phone answer speed across 285 hospital facilities. Each measures something different, so read the labels before you quote them.
Harvard Business Review published the audit in March 2011. Researchers sent a web-generated test lead to 2,241 US companies and timed the replies: 37% answered within an hour, 16% took between 1 and 24 hours, 24% took longer than a day, and 23% never responded at all. Among companies that did respond within 30 days, the average was 42 hours. A separate dataset of 1.25 million leads produced the often-quoted multiples, roughly 7 times better qualification odds inside the first hour and more than 60 times better than waiting a day.
The closest thing to a healthcare figure is thin. A marketing agency reports a 2018 analysis of 11 elective medical practices over 2 years that found an average response time of 5 hours 48 minutes and a 65% higher consultation conversion rate when the call went out within 21 minutes rather than 3 hours. Eleven practices is a case study, not a benchmark, and note that the winning window there was 21 minutes, not 5.
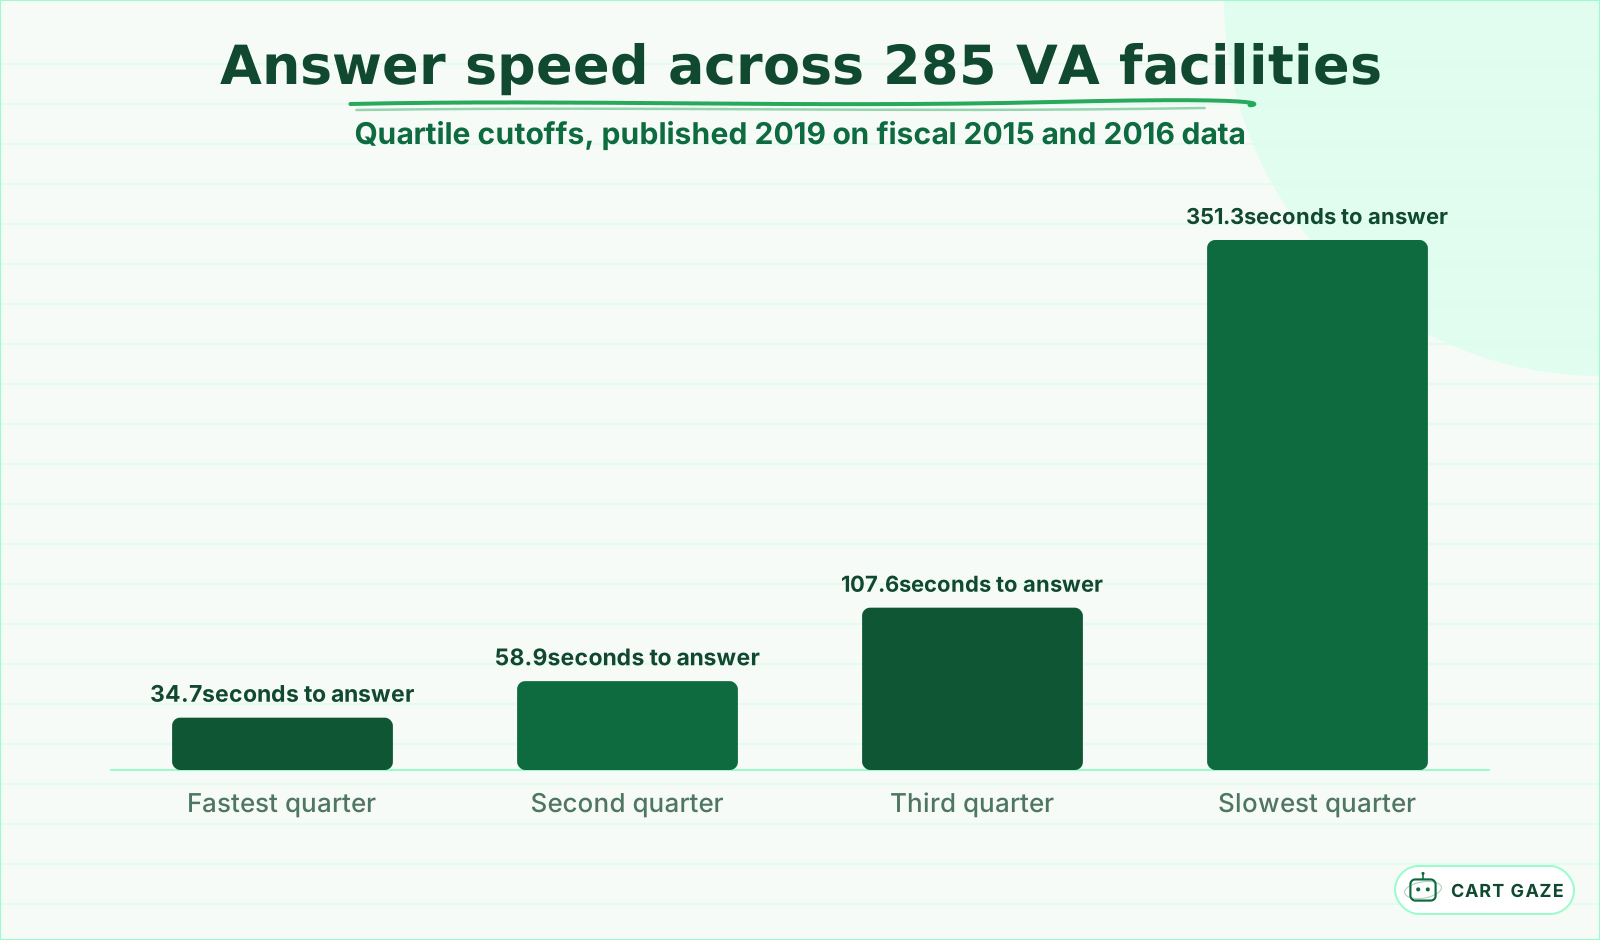 A real distribution, not a target. The slowest quarter answered in minutes.
Phone answer speed is on firmer ground, because someone measured facilities instead of leads. A study in the American Journal of Managed Care, published September 2019, linked survey responses from 252,145 patients to telephone metrics at 285 Veterans Health Administration facilities across fiscal 2015 and 2016. Average speed of answer ran from 34.7 seconds in the fastest quarter of facilities to 351.3 seconds in the slowest. Abandonment ranged from 6.1% to 29.1%, and fell overall from 12.0% to 8.3% during the period. Slower answering was associated with worse patient ratings of appointment access. Abandonment rate, interestingly, was not.
The 4 clocks worth timing on every new-patient inquiry
Four clocks tell you almost everything: time to first touch, time to human, time to booked, and abandonment by ring count. Each has a start event and a stop event you write down before you measure anything. Report the median and the slowest tenth of inquiries, never the average.
| Clock | Starts when | Stops when | What it tells you |
|---|---|---|---|
| Time to first touch | The inquiry arrives | Anything acknowledges it, human or automated | Whether anything happens at all |
| Time to human | The inquiry arrives | A live person is speaking or typing | What your phone tree is hiding |
| Time to booked | The inquiry arrives | An appointment is confirmed | The only clock tied to revenue |
| Abandonment by ring count | The phone starts ringing | The caller hangs up | Where your patience budget runs out |
Time to human is the one most practices skip, and it is usually the ugliest. An auto-attendant answers every call in under a second, so the answer rate on the report looks close to perfect while the caller is still waiting for a person. Two numbers, kept separate, stop that illusion.
Abandonment by ring count needs one piece of arithmetic. In the United States the ring cycle is 6 seconds, so 5 rings is 30 seconds and 10 rings is a full minute. Tally hang-ups at ring 3, ring 5, and ring 10 and you find your own cliff instead of borrowing someone else's. One call-tracking vendor, compiling healthcare research, reports that over 60% of callers in a queue give up after 1 minute of waiting. Treat that as a reason to count, not as your number.
Use the median, not the mean. The 42-hour average in the HBR audit is a mean dragged upward by a long tail of firms that took days. The healthcare study reported quartiles instead, which is why it is still useful 7 years later. Pair it with the slowest tenth to see the typical case and the disasters at once.
How to time your own response by channel, hour, and day
One blended average hides the problem. A phone call is abandoned in seconds while a web form sits in an inbox for hours, and a Monday morning behaves nothing like a Thursday afternoon. Split every response time three ways, by channel, by hour of day, and by day of week.
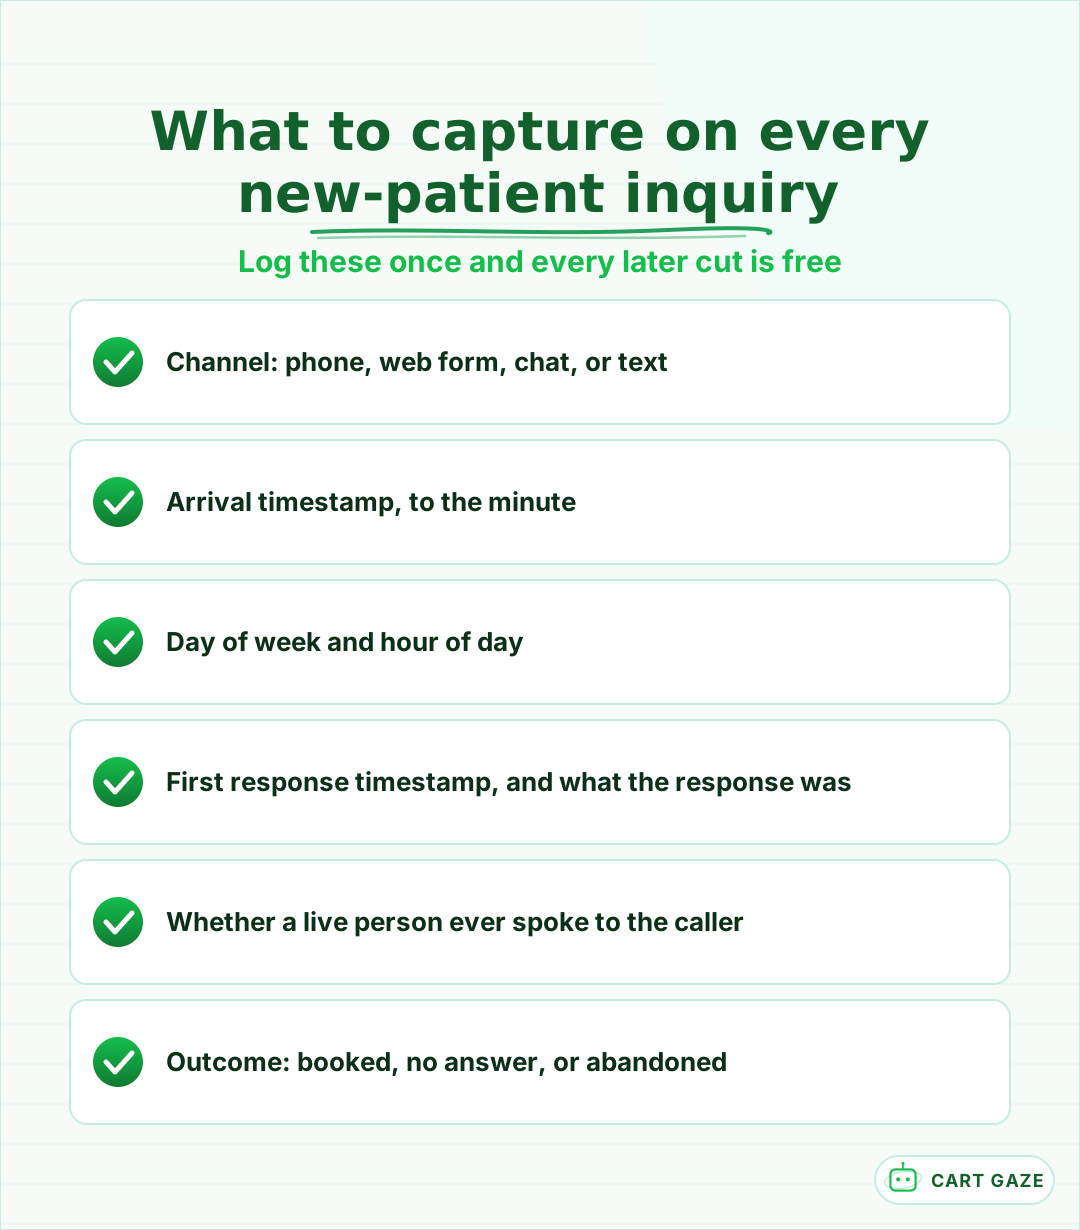 Six fields. Without them you get one average and no idea which hour leaks.
Channels fail for different reasons, so a single number for all of them is worse than no number. A caller decides in under a minute. A form submitter has already moved on to the next tab and will judge you tomorrow. Measure them apart or you will buy a fix for the wrong one.
Timing matters as much as the average. The 2007 study found time of day mattered more than day of week, with the 4 to 6 p.m. block strongest for reaching someone. A vendor call-tracking analysis reports Monday 8 to 10 a.m. running about 40% above average volume against thinner coverage. Both are reasons to break your own log into hours before you conclude that staffing is fine.
You do not need a reporting project to start. 20 to 30 new-patient inquiries over 5 business days is enough to see a pattern, and a paper tally sheet by the phone beats an export you keep meaning to build.
What counts as an answer, and what counts as a hang-up
Borrow the definitions instead of inventing them. Federal secret shopper guidance already says when a practice counts as unresponsive: the phone rings 5 minutes with nobody picking up, a business-hours voicemail greeting answers, or the caller waits more than 15 minutes on hold. Those thresholds are written down.
That guidance comes from the CMS technical rules for Marketplace plan appointment wait times, published April 2024 and in force from 1 January 2025. It also treats an invalid number and a failed connection as nonresponsive, and it requires 3 separate attempts at least 24 hours apart before a provider is marked that way. Someone has already done the work of turning "they never got back to me" into testable conditions.
One detail is worth copying outright. If a practice requires the caller to leave a voicemail to get a callback, the shopper does not leave one, and the elapsed time is recorded as not applicable. A message you cannot return on the caller's terms is not counted as a response.
Keep two different clocks apart while you are at it. Those same CMS rules set appointment availability standards of 10 business days for behavioral health, 15 for routine primary care, and 30 for non-urgent specialty care, met at least 90% of the time. That measures days until a visit. Speed to lead measures minutes until a reply. Mixing them produces a report nobody can act on.
Set a target you can defend, then re-measure
A target that survives a partner meeting names 4 things: which clock, which percentile, which window, and which channel. Median time to human under 60 seconds on the main line between 8 a.m. and 5 p.m. is a target. Answer faster is a wish, and nobody can check it.
Reasonable starting points, offered as starting points rather than audited standards: a median time to first touch under 5 minutes on every channel, a median time to human under 60 seconds during business hours, which sits around the second quartile of that 285-facility distribution, and abandonment held under 8%. The number you set on day 1 matters far less than measuring the same way on day 30.
Re-measure with the same definitions, the same channel split, and the same length of date range. Quietly changing what counts as a response between the before and the after is the most common way a practice talks itself into believing something worked.
Pick one clock and start timing it this week
Start with one clock, not four. If an auto-attendant answers before a person does, time to human is the number hiding the most. If a person picks up your main line, start with time to first touch. Add the other three once the first number stops surprising you.
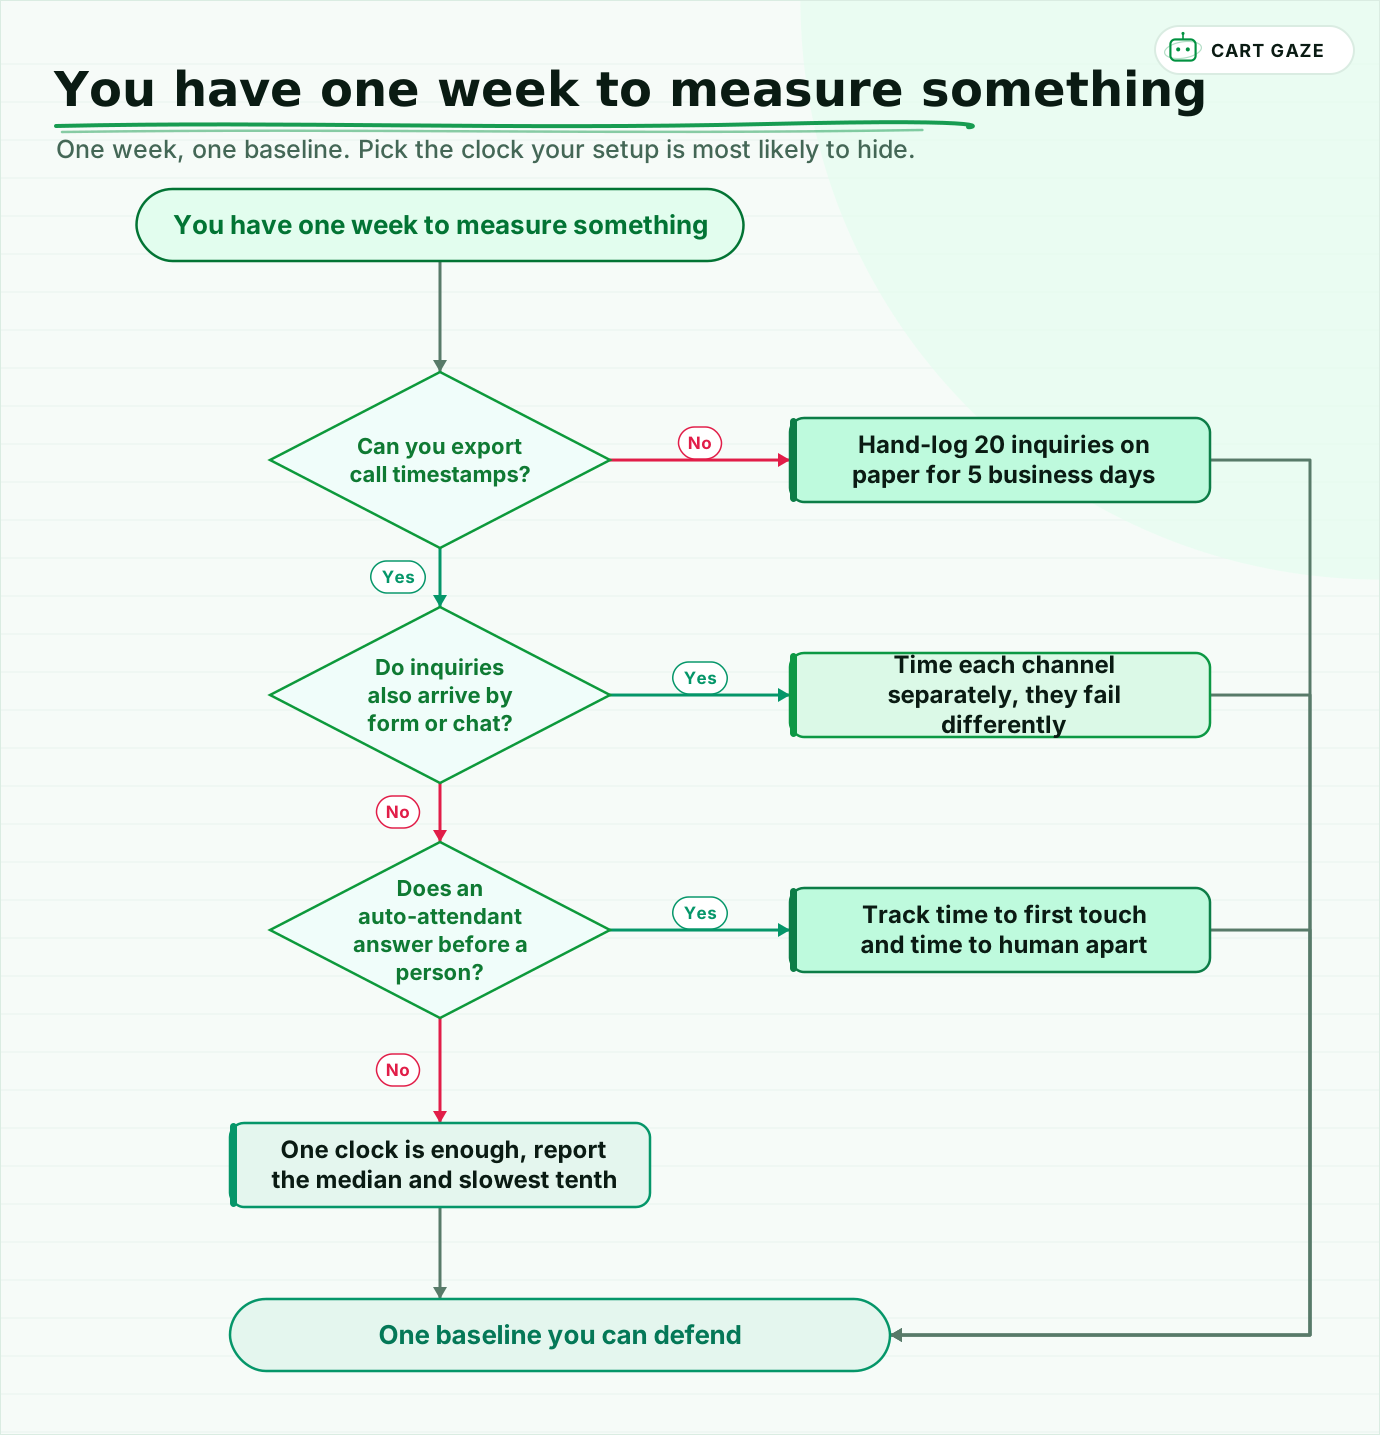 One week, one baseline. Pick the clock your setup is most likely to hide.
Walk the flow once with your own setup in mind. The branch that matters most is whether inquiries arrive on more than one channel, because a front desk running phone, form, and chat usually has one of them quietly running hours behind.
Only then is a tooling conversation worth having. Always-on answering changes time to first touch the day it goes live, and it changes time to booked only if it can genuinely confirm an appointment rather than take a message. Before you assume it does either, read what an AI receptionist actually does and where it stops, and hold any vendor's demo up against the baseline you just measured.
If you would rather see the gap sized in dollars first, the free Growth Leak Audit runs your own inquiry volumes and response times into a number, with no demo attached.
Fair questions.
What is a good speed to lead benchmark for a medical practice?
No audited healthcare benchmark exists. A defensible starting target is a median time to first touch under 5 minutes on every channel and a median time to human under 60 seconds during business hours, which sits near the middle of the 285-facility answer-speed distribution published in 2019. Set it, then measure the same way 30 days later.
Where does the 5-minute rule for lead response actually come from?
From a study by Dr James Oldroyd with InsideSales.com, presented in October 2007. It covered 3 years of data at 6 business-to-business companies, over 15,000 web-form leads and over 100,000 call attempts, and found qualification odds dropped 21 times between a 5-minute and a 30-minute response. It measured sales prospects, not patients.
How do I measure my own first response time without new software?
Take 20 to 30 new-patient inquiries over 5 business days and log 5 things for each: the channel, the arrival time, the first response time, whether a live person ever spoke, and the outcome. A paper tally sheet by the phone works. Exclude existing patients, since a rescheduling call is a different clock.
Should I report the average or the median response time?
Report the median, plus the slowest tenth of inquiries. Averages get dragged upward by a few extreme cases, which is why the 2011 audit produced a 42-hour figure that describes almost nobody. The 2019 healthcare study reported quartiles instead, and that is the format worth copying for your own baseline.
Does an AI receptionist improve speed to lead?
It changes time to first touch immediately, because something answers around the clock. It only changes time to booked if it can confirm a real appointment rather than take a message. Measure your baseline before any demo, and require that clinical or urgent inquiries route to a licensed person instead of being answered faster.
Sources.
- [1]Lead Response Management study overview (Oldroyd, InsideSales.com)
- [2]Executive summary: how much time do you have before web-generated leads go cold (2007)
- [3]The Short Life of Online Sales Leads, Harvard Business Review, March 2011
- [4]Call center performance affects patient perceptions of access and satisfaction (AJMC, 2019)
- [5]Appointment Wait Time Secret Shopper Survey Technical Guidance for QHP Issuers (CMS, April 2024)
- [6]Average call abandonment rate in healthcare: benchmarks and trends
- [7]How many seconds is 6 rings, US and UK ring cadence
- [8]Responding to patient inquiries: timing, tone and perseverance
Written by

Muhammad Qasim Hammad
Founder, Cart Gaze
Qasim builds AI receptionists and front-office automation for medical and dental practices at Cart Gaze. Posts here start from published sources and real call data, not vendor claims, and every number links back to where it came from.
Keep reading.
 Patient Acquisition & GrowthSpeed to Lead: Why New Patients Book With Whoever Answers First11 min read
 Patient Acquisition & GrowthGoogle Business Profile Automation Without a HIPAA Slip10 min read
 Patient Acquisition & GrowthPatient Referral Programs: Ask More People, Reward Carefully10 min read
 Patient Acquisition & GrowthMissed Call Text Back for Medical Practices: How It Works10 min read
 Patient Acquisition & GrowthConsultation Follow Up That Converts Without Pressure9 min read
 Missed Calls & Front DeskFront Desk Call Metrics Every Practice Should Track in 202610 min read